Bahamian vs Cree 3rd Grade
COMPARE
Bahamian
Cree
3rd Grade
3rd Grade Comparison
Bahamians
Cree
97.5%
3RD GRADE
4.4/ 100
METRIC RATING
224th/ 347
METRIC RANK
98.1%
3RD GRADE
97.9/ 100
METRIC RATING
100th/ 347
METRIC RANK
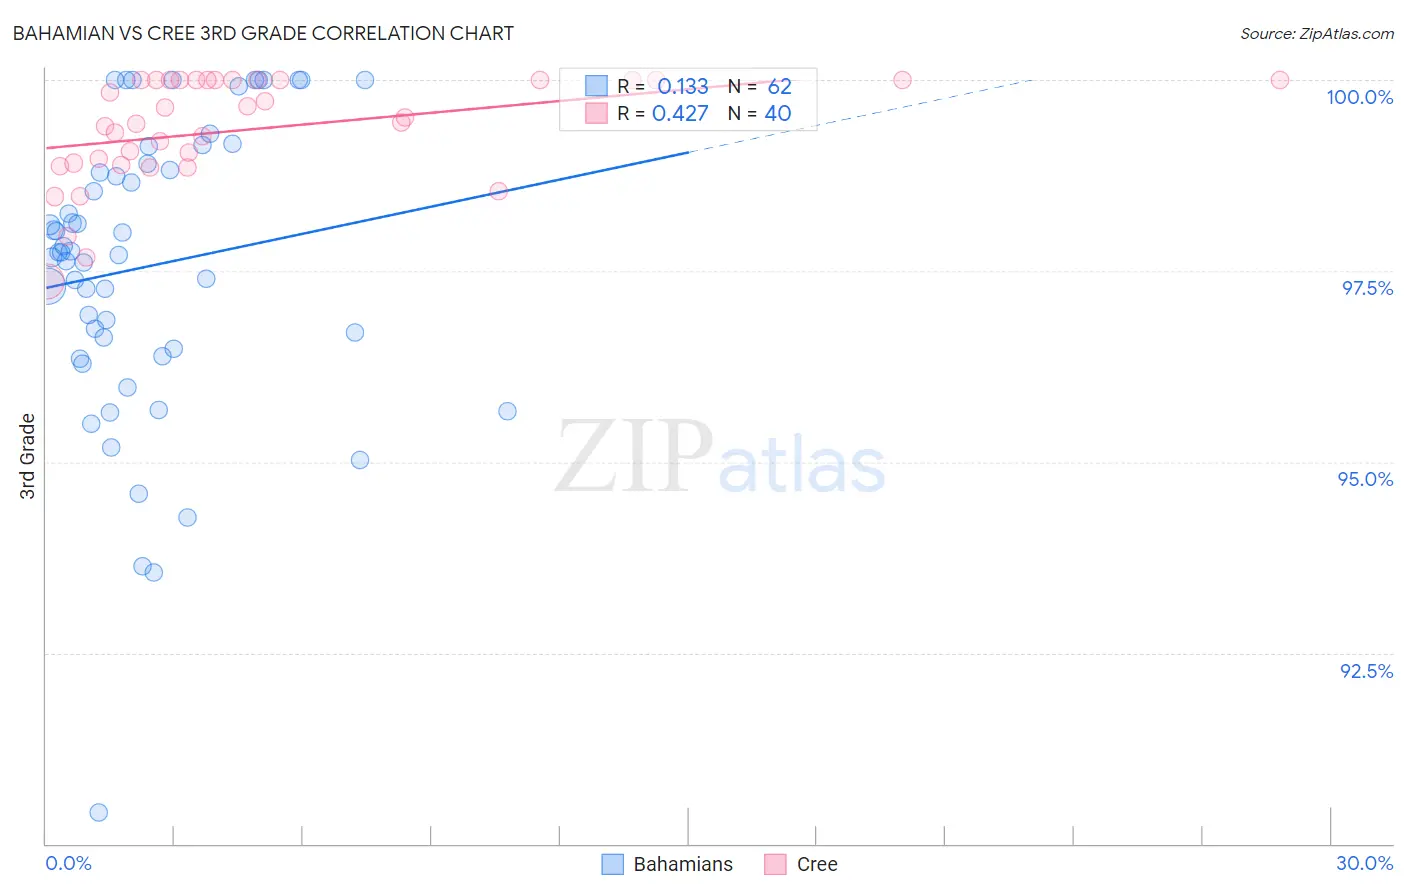
Bahamian vs Cree 3rd Grade Correlation Chart
The statistical analysis conducted on geographies consisting of 112,697,105 people shows a poor positive correlation between the proportion of Bahamians and percentage of population with at least 3rd grade education in the United States with a correlation coefficient (R) of 0.133 and weighted average of 97.5%. Similarly, the statistical analysis conducted on geographies consisting of 76,204,399 people shows a moderate positive correlation between the proportion of Cree and percentage of population with at least 3rd grade education in the United States with a correlation coefficient (R) of 0.427 and weighted average of 98.1%, a difference of 0.59%.
3rd Grade Correlation Summary
| Measurement | Bahamian | Cree |
| Minimum | 90.4% | 97.4% |
| Maximum | 100.0% | 100.0% |
| Range | 9.6% | 2.6% |
| Mean | 97.6% | 99.4% |
| Median | 97.7% | 99.5% |
| Interquartile 25% (IQ1) | 96.5% | 98.9% |
| Interquartile 75% (IQ3) | 98.9% | 100.0% |
| Interquartile Range (IQR) | 2.4% | 1.1% |
| Standard Deviation (Sample) | 1.9% | 0.70% |
| Standard Deviation (Population) | 1.9% | 0.69% |
Similar Demographics by 3rd Grade
Demographics Similar to Bahamians by 3rd Grade
In terms of 3rd grade, the demographic groups most similar to Bahamians are Sierra Leonean (97.5%, a difference of 0.0%), Immigrants from Syria (97.5%, a difference of 0.0%), Tongan (97.5%, a difference of 0.0%), Immigrants from Morocco (97.5%, a difference of 0.010%), and Uruguayan (97.5%, a difference of 0.010%).
| Demographics | Rating | Rank | 3rd Grade |
| South American Indians | 5.7 /100 | #217 | Tragic 97.5% |
| Immigrants | Nepal | 5.3 /100 | #218 | Tragic 97.5% |
| Immigrants | Panama | 5.2 /100 | #219 | Tragic 97.5% |
| Immigrants | Morocco | 5.0 /100 | #220 | Tragic 97.5% |
| Uruguayans | 5.0 /100 | #221 | Tragic 97.5% |
| Sierra Leoneans | 4.6 /100 | #222 | Tragic 97.5% |
| Immigrants | Syria | 4.4 /100 | #223 | Tragic 97.5% |
| Bahamians | 4.4 /100 | #224 | Tragic 97.5% |
| Tongans | 4.3 /100 | #225 | Tragic 97.5% |
| Sudanese | 4.1 /100 | #226 | Tragic 97.5% |
| Immigrants | Sudan | 3.4 /100 | #227 | Tragic 97.5% |
| Sub-Saharan Africans | 3.2 /100 | #228 | Tragic 97.5% |
| Senegalese | 3.0 /100 | #229 | Tragic 97.5% |
| Immigrants | Pakistan | 2.7 /100 | #230 | Tragic 97.5% |
| Immigrants | Costa Rica | 2.7 /100 | #231 | Tragic 97.5% |
Demographics Similar to Cree by 3rd Grade
In terms of 3rd grade, the demographic groups most similar to Cree are Choctaw (98.1%, a difference of 0.0%), Romanian (98.1%, a difference of 0.0%), Puget Sound Salish (98.1%, a difference of 0.0%), Nonimmigrants (98.1%, a difference of 0.0%), and Immigrants from Ireland (98.1%, a difference of 0.010%).
| Demographics | Rating | Rank | 3rd Grade |
| Immigrants | Western Europe | 98.7 /100 | #93 | Exceptional 98.1% |
| Immigrants | Germany | 98.4 /100 | #94 | Exceptional 98.1% |
| Cypriots | 98.4 /100 | #95 | Exceptional 98.1% |
| Immigrants | Ireland | 98.2 /100 | #96 | Exceptional 98.1% |
| South Africans | 98.2 /100 | #97 | Exceptional 98.1% |
| Choctaw | 98.0 /100 | #98 | Exceptional 98.1% |
| Romanians | 98.0 /100 | #99 | Exceptional 98.1% |
| Cree | 97.9 /100 | #100 | Exceptional 98.1% |
| Puget Sound Salish | 97.9 /100 | #101 | Exceptional 98.1% |
| Immigrants | Nonimmigrants | 97.8 /100 | #102 | Exceptional 98.1% |
| Yugoslavians | 97.7 /100 | #103 | Exceptional 98.1% |
| Turks | 97.6 /100 | #104 | Exceptional 98.1% |
| German Russians | 97.2 /100 | #105 | Exceptional 98.1% |
| Bhutanese | 97.2 /100 | #106 | Exceptional 98.1% |
| Immigrants | Czechoslovakia | 97.0 /100 | #107 | Exceptional 98.0% |