Immigrants from Romania vs Asian 3rd Grade
COMPARE
Immigrants from Romania
Asian
3rd Grade
3rd Grade Comparison
Immigrants from Romania
Asians
97.9%
3RD GRADE
87.9/ 100
METRIC RATING
137th/ 347
METRIC RANK
97.4%
3RD GRADE
1.1/ 100
METRIC RATING
244th/ 347
METRIC RANK
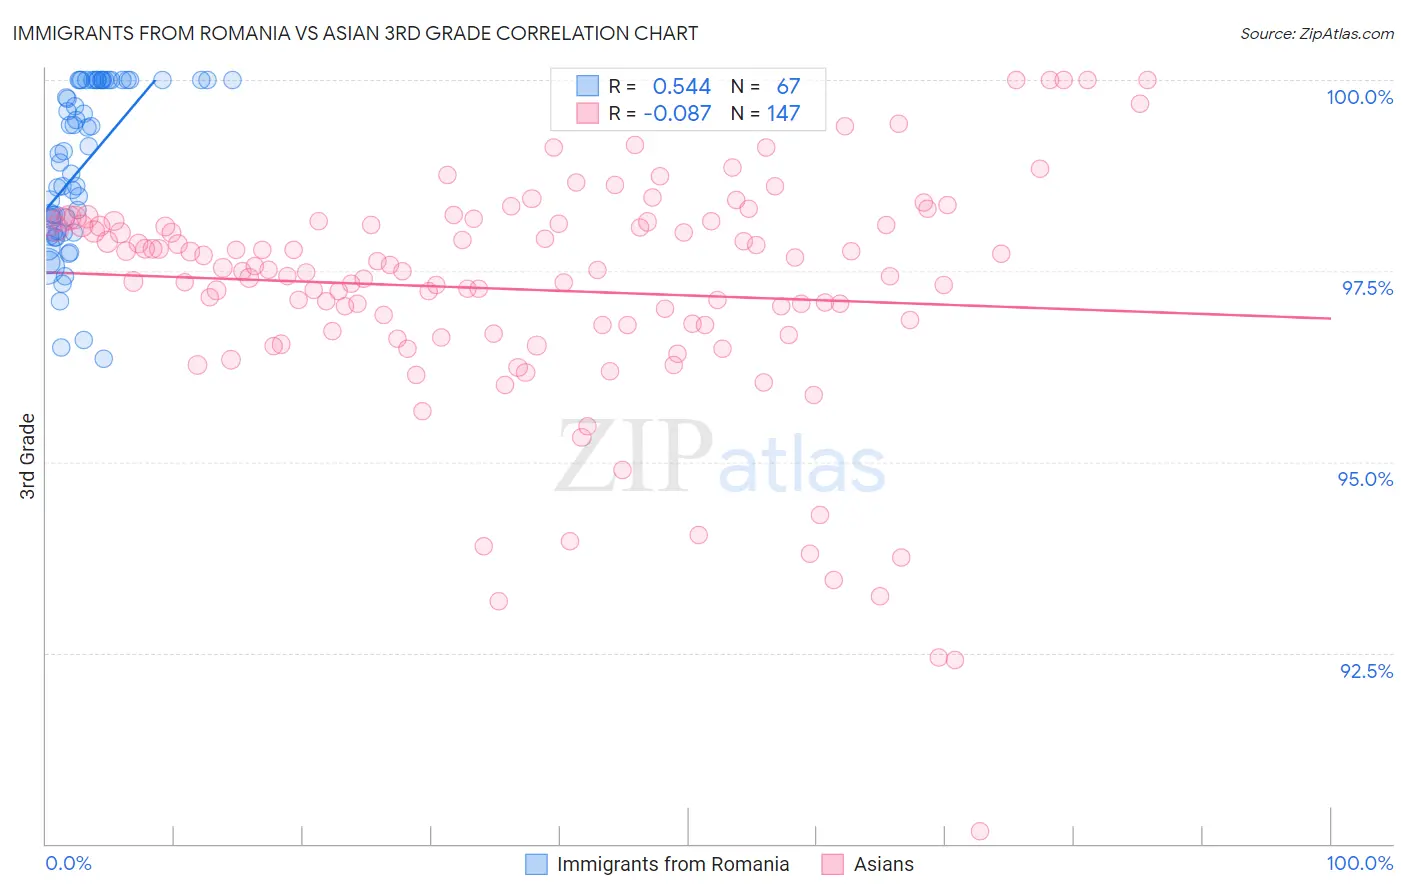
Immigrants from Romania vs Asian 3rd Grade Correlation Chart
The statistical analysis conducted on geographies consisting of 257,006,599 people shows a substantial positive correlation between the proportion of Immigrants from Romania and percentage of population with at least 3rd grade education in the United States with a correlation coefficient (R) of 0.544 and weighted average of 97.9%. Similarly, the statistical analysis conducted on geographies consisting of 550,801,467 people shows a slight negative correlation between the proportion of Asians and percentage of population with at least 3rd grade education in the United States with a correlation coefficient (R) of -0.087 and weighted average of 97.4%, a difference of 0.55%.
3rd Grade Correlation Summary
| Measurement | Immigrants from Romania | Asian |
| Minimum | 96.4% | 90.2% |
| Maximum | 100.0% | 100.0% |
| Range | 3.6% | 9.8% |
| Mean | 98.9% | 97.3% |
| Median | 99.0% | 97.5% |
| Interquartile 25% (IQ1) | 98.0% | 96.7% |
| Interquartile 75% (IQ3) | 100.0% | 98.1% |
| Interquartile Range (IQR) | 2.0% | 1.4% |
| Standard Deviation (Sample) | 1.0% | 1.6% |
| Standard Deviation (Population) | 1.0% | 1.6% |
Similar Demographics by 3rd Grade
Demographics Similar to Immigrants from Romania by 3rd Grade
In terms of 3rd grade, the demographic groups most similar to Immigrants from Romania are Cambodian (97.9%, a difference of 0.0%), Spaniard (97.9%, a difference of 0.0%), Immigrants from Bulgaria (97.9%, a difference of 0.010%), Immigrants from Hungary (97.9%, a difference of 0.010%), and Immigrants from Kuwait (97.9%, a difference of 0.010%).
| Demographics | Rating | Rank | 3rd Grade |
| Immigrants | Europe | 91.2 /100 | #130 | Exceptional 98.0% |
| Immigrants | Bulgaria | 89.1 /100 | #131 | Excellent 97.9% |
| Immigrants | Hungary | 88.8 /100 | #132 | Excellent 97.9% |
| Immigrants | Kuwait | 88.7 /100 | #133 | Excellent 97.9% |
| Seminole | 88.7 /100 | #134 | Excellent 97.9% |
| Cambodians | 88.1 /100 | #135 | Excellent 97.9% |
| Spaniards | 87.9 /100 | #136 | Excellent 97.9% |
| Immigrants | Romania | 87.9 /100 | #137 | Excellent 97.9% |
| Israelis | 86.6 /100 | #138 | Excellent 97.9% |
| Blackfeet | 86.3 /100 | #139 | Excellent 97.9% |
| Palestinians | 84.6 /100 | #140 | Excellent 97.9% |
| Immigrants | Turkey | 83.5 /100 | #141 | Excellent 97.9% |
| Hmong | 80.3 /100 | #142 | Excellent 97.9% |
| Filipinos | 79.9 /100 | #143 | Good 97.9% |
| Burmese | 79.6 /100 | #144 | Good 97.9% |
Demographics Similar to Asians by 3rd Grade
In terms of 3rd grade, the demographic groups most similar to Asians are Ethiopian (97.4%, a difference of 0.0%), Korean (97.4%, a difference of 0.010%), Indian (Asian) (97.4%, a difference of 0.010%), Immigrants from Senegal (97.4%, a difference of 0.010%), and Assyrian/Chaldean/Syriac (97.4%, a difference of 0.010%).
| Demographics | Rating | Rank | 3rd Grade |
| Colombians | 1.8 /100 | #237 | Tragic 97.4% |
| Immigrants | Uruguay | 1.7 /100 | #238 | Tragic 97.4% |
| Nigerians | 1.6 /100 | #239 | Tragic 97.4% |
| U.S. Virgin Islanders | 1.4 /100 | #240 | Tragic 97.4% |
| Immigrants | Indonesia | 1.4 /100 | #241 | Tragic 97.4% |
| Koreans | 1.3 /100 | #242 | Tragic 97.4% |
| Indians (Asian) | 1.3 /100 | #243 | Tragic 97.4% |
| Asians | 1.1 /100 | #244 | Tragic 97.4% |
| Ethiopians | 1.1 /100 | #245 | Tragic 97.4% |
| Immigrants | Senegal | 1.0 /100 | #246 | Tragic 97.4% |
| Assyrians/Chaldeans/Syriacs | 1.0 /100 | #247 | Tragic 97.4% |
| Immigrants | Eastern Africa | 0.9 /100 | #248 | Tragic 97.4% |
| South Americans | 0.9 /100 | #249 | Tragic 97.4% |
| Immigrants | Middle Africa | 0.9 /100 | #250 | Tragic 97.4% |
| Immigrants | Asia | 0.8 /100 | #251 | Tragic 97.4% |