Salvadoran vs Immigrants from Cambodia Master's Degree

COMPARE

Salvadoran
Race
Ancestry
AfghanAfricanAlaska NativeAlaskan AthabascanAlbanianAleutAlsatianAmericanApacheArabArapahoArgentineanArmenianAssyrian/Chaldean/SyriacAustralianAustrianBahamianBangladeshiBarbadianBasqueBelgianBelizeanBermudanBhutaneseBlackfeetBolivianBrazilianBritishBritish West IndianBulgarianBurmeseCajunCambodianCanadianCape VerdeanCarpatho RusynCelticCentral AmericanCentral American IndianCherokeeCheyenneChickasawChileanChineseChippewaChoctawColombianColvilleComancheCosta RicanCreeCreekCroatianCrowCubanCypriotCzechCzechoslovakianDanishDelawareDominicanDutchDutch West IndianEastern EuropeanEcuadorianEgyptianEnglishEstonianEthiopianEuropeanFijianFilipinoFinnishFrenchFrench American IndianFrench CanadianGermanGerman RussianGhanaianGreekGuamanian/ChamorroGuatemalanGuyaneseHaitianHmongHonduranHopiHoumaHungarianIcelanderIndian (Asian)IndonesianInupiatIranianIraqiIrishIroquoisIsraeliItalianJamaicanJapaneseJordanianKenyanKiowaKoreanLaotianLatvianLebaneseLiberianLithuanianLumbeeLuxembourgerMacedonianMalaysianMalteseMarshalleseMenomineeMexicanMexican American IndianMongolianMoroccanNative HawaiianNavajoNepaleseNew ZealanderNicaraguanNigerianNorthern EuropeanNorwegianOkinawanOsageOttawaPaiutePakistaniPalestinianPanamanianParaguayanPennsylvania GermanPeruvianPimaPolishPortuguesePotawatomiPuebloPuerto RicanPuget Sound SalishRomanianRussianSalvadoranSamoanScandinavianScotch-IrishScottishSeminoleSenegaleseSerbianShoshoneSierra LeoneanSiouxSlavicSlovakSloveneSomaliSouth AfricanSouth AmericanSouth American IndianSoviet UnionSpaniardSpanishSpanish AmericanSpanish American IndianSri LankanSubsaharan AfricanSudaneseSwedishSwissSyrianTaiwaneseThaiTlingit-HaidaTohono O'OdhamTonganTrinidadian and TobagonianTsimshianTurkishU.S. Virgin IslanderUgandanUkrainianUruguayanUteVenezuelanVietnameseWelshWest IndianYakamaYaquiYugoslavianYumanYup'ikZimbabwean
Immigration
NonimmigrantsImmigrantsAfghanistanAfricaAlbaniaArgentinaArmeniaAsiaAustraliaAustriaBahamasBangladeshBarbadosBelarusBelgiumBelizeBoliviaBosnia and HerzegovinaBrazilBulgariaBurma/MyanmarCabo VerdeCameroonCanadaCaribbeanCentral AmericaChileChinaColombiaCongoCosta RicaCroatiaCubaCzechoslovakiaDenmarkDominicaDominican RepublicEastern AfricaEastern AsiaEastern EuropeEcuadorEgyptEl SalvadorEnglandEritreaEthiopiaEuropeFijiFranceGermanyGhanaGreeceGrenadaGuatemalaGuyanaHaitiHondurasHong KongHungaryIndiaIndonesiaIranIraqIrelandIsraelItalyJamaicaJapanJordanKazakhstanKenyaKoreaKuwaitLaosLatin AmericaLatviaLebanonLiberiaLithuaniaMalaysiaMexicoMicronesiaMiddle AfricaMoldovaMoroccoNepalNetherlandsNicaraguaNigeriaNorth AmericaNorth MacedoniaNorthern AfricaNorthern EuropeNorwayOceaniaPakistanPanamaPeruPhilippinesPolandPortugalRomaniaRussiaSaudi ArabiaScotlandSenegalSerbiaSierra LeoneSingaporeSomaliaSouth AfricaSouth AmericaSouth Central AsiaSouth Eastern AsiaSouthern EuropeSpainSri LankaSt. Vincent and the GrenadinesSudanSwedenSwitzerlandSyriaTaiwanThailandTrinidad and TobagoTurkeyUgandaUkraineUruguayUzbekistanVenezuelaVietnamWest IndiesWestern AfricaWestern AsiaWestern EuropeYemenZaireZimbabweAzores
Immigrants from Cambodia
Race
Ancestry
AfghanAfricanAlaska NativeAlaskan AthabascanAlbanianAleutAlsatianAmericanApacheArabArapahoArgentineanArmenianAssyrian/Chaldean/SyriacAustralianAustrianBahamianBangladeshiBarbadianBasqueBelgianBelizeanBermudanBhutaneseBlackfeetBolivianBrazilianBritishBritish West IndianBulgarianBurmeseCajunCambodianCanadianCape VerdeanCarpatho RusynCelticCentral AmericanCentral American IndianCherokeeCheyenneChickasawChileanChineseChippewaChoctawColombianColvilleComancheCosta RicanCreeCreekCroatianCrowCubanCypriotCzechCzechoslovakianDanishDelawareDominicanDutchDutch West IndianEastern EuropeanEcuadorianEgyptianEnglishEstonianEthiopianEuropeanFijianFilipinoFinnishFrenchFrench American IndianFrench CanadianGermanGerman RussianGhanaianGreekGuamanian/ChamorroGuatemalanGuyaneseHaitianHmongHonduranHopiHoumaHungarianIcelanderIndian (Asian)IndonesianInupiatIranianIraqiIrishIroquoisIsraeliItalianJamaicanJapaneseJordanianKenyanKiowaKoreanLaotianLatvianLebaneseLiberianLithuanianLumbeeLuxembourgerMacedonianMalaysianMalteseMarshalleseMenomineeMexicanMexican American IndianMongolianMoroccanNative HawaiianNavajoNepaleseNew ZealanderNicaraguanNigerianNorthern EuropeanNorwegianOkinawanOsageOttawaPaiutePakistaniPalestinianPanamanianParaguayanPennsylvania GermanPeruvianPimaPolishPortuguesePotawatomiPuebloPuerto RicanPuget Sound SalishRomanianRussianSamoanScandinavianScotch-IrishScottishSeminoleSenegaleseSerbianShoshoneSierra LeoneanSiouxSlavicSlovakSloveneSomaliSouth AfricanSouth AmericanSouth American IndianSoviet UnionSpaniardSpanishSpanish AmericanSpanish American IndianSri LankanSubsaharan AfricanSudaneseSwedishSwissSyrianTaiwaneseThaiTlingit-HaidaTohono O'OdhamTonganTrinidadian and TobagonianTsimshianTurkishU.S. Virgin IslanderUgandanUkrainianUruguayanUteVenezuelanVietnameseWelshWest IndianYakamaYaquiYugoslavianYumanYup'ikZimbabwean
Immigration
NonimmigrantsImmigrantsAfghanistanAfricaAlbaniaArgentinaArmeniaAsiaAustraliaAustriaBahamasBangladeshBarbadosBelarusBelgiumBelizeBoliviaBosnia and HerzegovinaBrazilBulgariaBurma/MyanmarCabo VerdeCambodiaCameroonCanadaCaribbeanCentral AmericaChileChinaColombiaCongoCosta RicaCroatiaCubaCzechoslovakiaDenmarkDominicaDominican RepublicEastern AfricaEastern AsiaEastern EuropeEcuadorEgyptEl SalvadorEnglandEritreaEthiopiaEuropeFijiFranceGermanyGhanaGreeceGrenadaGuatemalaGuyanaHaitiHondurasHong KongHungaryIndiaIndonesiaIranIraqIrelandIsraelItalyJamaicaJapanJordanKazakhstanKenyaKoreaKuwaitLaosLatin AmericaLatviaLebanonLiberiaLithuaniaMalaysiaMexicoMicronesiaMiddle AfricaMoldovaMoroccoNepalNetherlandsNicaraguaNigeriaNorth AmericaNorth MacedoniaNorthern AfricaNorthern EuropeNorwayOceaniaPakistanPanamaPeruPhilippinesPolandPortugalRomaniaRussiaSaudi ArabiaScotlandSenegalSerbiaSierra LeoneSingaporeSomaliaSouth AfricaSouth AmericaSouth Central AsiaSouth Eastern AsiaSouthern EuropeSpainSri LankaSt. Vincent and the GrenadinesSudanSwedenSwitzerlandSyriaTaiwanThailandTrinidad and TobagoTurkeyUgandaUkraineUruguayUzbekistanVenezuelaVietnamWest IndiesWestern AfricaWestern AsiaWestern EuropeYemenZaireZimbabweAzores
Master's Degree
Income
Poverty
Unemployment
Labor Participation
Family Structure
Vehicle Availability
Education Level
Disability

Master's Degree Comparison

Salvadorans

Immigrants from Cambodia

Tragic
Tragic
12.2%
MASTER'S DEGREE
0.3/ 100
METRIC RATING
270th/ 347
METRIC RANK
12.9%
MASTER'S DEGREE
1.4/ 100
METRIC RATING
246th/ 347
METRIC RANK

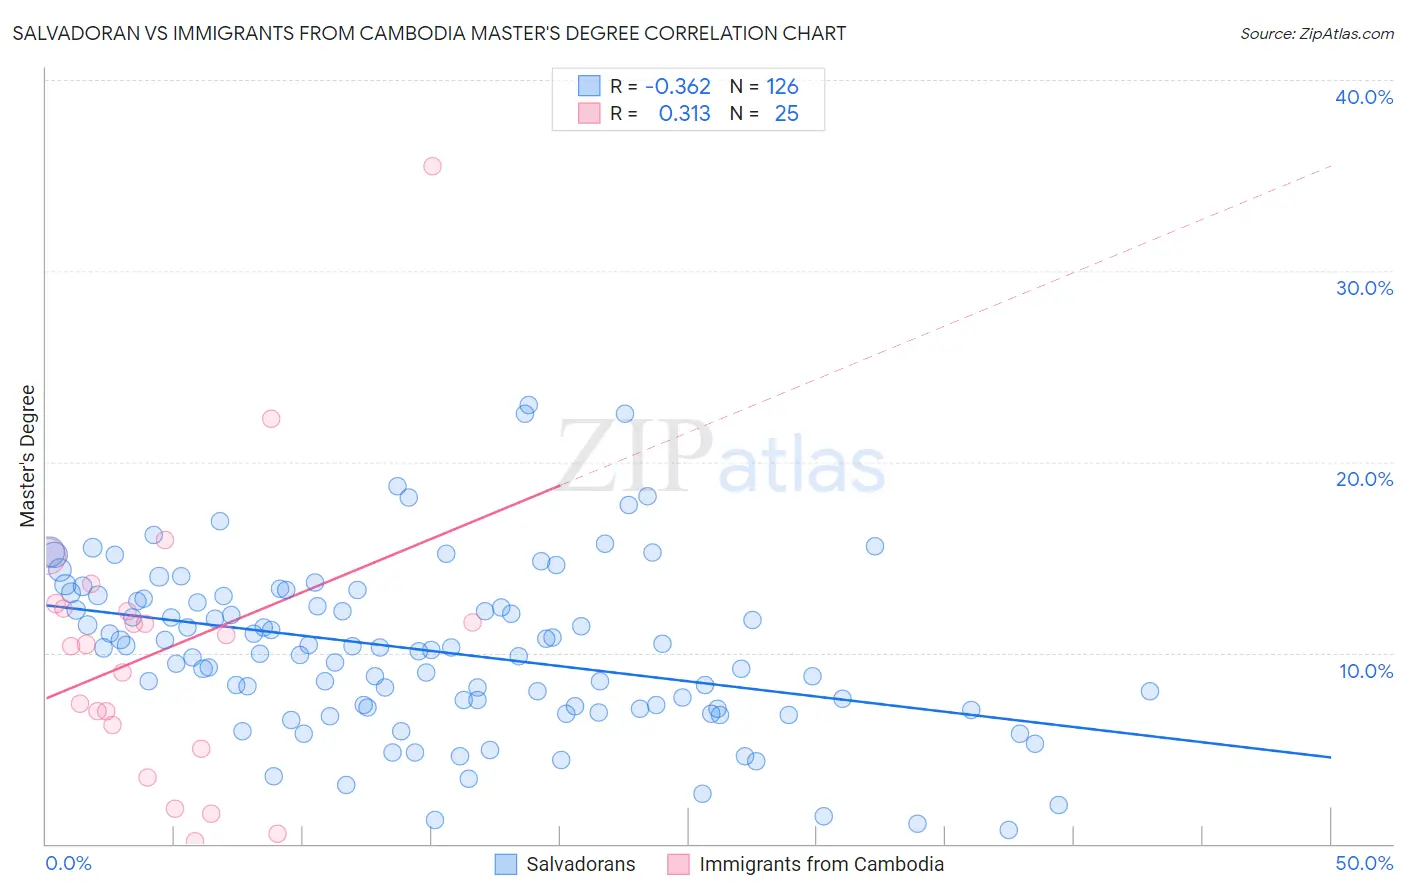
Salvadoran vs Immigrants from Cambodia Master's Degree Correlation Chart

The statistical analysis conducted on geographies consisting of 398,764,232 people shows a mild negative correlation between the proportion of Salvadorans and percentage of population with at least master's degree education in the United States with a correlation coefficient (R) of -0.362 and weighted average of 12.2%. Similarly, the statistical analysis conducted on geographies consisting of 205,124,536 people shows a mild positive correlation between the proportion of Immigrants from Cambodia and percentage of population with at least master's degree education in the United States with a correlation coefficient (R) of 0.313 and weighted average of 12.9%, a difference of 5.9%.
Salvadoran vs Immigrants from Cambodia Master's Degree

Master's Degree Correlation Summary

MeasurementSalvadoranImmigrants from Cambodia
Minimum0.69%0.16%
Maximum23.0%35.5%
Range22.3%35.3%
Mean10.1%10.2%
Median10.2%10.4%
Interquartile 25% (IQ1)7.1%5.6%
Interquartile 75% (IQ3)12.9%12.5%
Interquartile Range (IQR)5.7%6.9%
Standard Deviation (Sample)4.4%7.4%
Standard Deviation (Population)4.4%7.3%

Similar Demographics by Master's Degree

Demographics Similar to Salvadorans by Master's Degree

In terms of master's degree, the demographic groups most similar to Salvadorans are Central American (12.2%, a difference of 0.13%), Haitian (12.1%, a difference of 0.59%), Comanche (12.1%, a difference of 0.64%), Blackfeet (12.1%, a difference of 0.74%), and Native Hawaiian (12.3%, a difference of 0.78%).
DemographicsRating | RankMaster's Degree
Central American Indians
0.5
/100
|
#263
Tragic
12.4%
Belizeans
0.5
/100
|
#264
Tragic
12.4%
Immigrants | Fiji
0.5
/100
|
#265
Tragic
12.4%
Bahamians
0.5
/100
|
#266
Tragic
12.4%
Americans
0.4
/100
|
#267
Tragic
12.3%
Native Hawaiians
0.4
/100
|
#268
Tragic
12.3%
Central Americans
0.3
/100
|
#269
Tragic
12.2%
Salvadorans
0.3
/100
|
#270
Tragic
12.2%
Haitians
0.3
/100
|
#271
Tragic
12.1%
Comanche
0.3
/100
|
#272
Tragic
12.1%
Blackfeet
0.3
/100
|
#273
Tragic
12.1%
Cape Verdeans
0.3
/100
|
#274
Tragic
12.1%
Cubans
0.3
/100
|
#275
Tragic
12.1%
Blacks/African Americans
0.3
/100
|
#276
Tragic
12.1%
Immigrants | Caribbean
0.3
/100
|
#277
Tragic
12.1%

Demographics Similar to Immigrants from Cambodia by Master's Degree

In terms of master's degree, the demographic groups most similar to Immigrants from Cambodia are Iroquois (12.9%, a difference of 0.030%), Immigrants from Bahamas (12.9%, a difference of 0.040%), African (12.9%, a difference of 0.12%), Cree (12.8%, a difference of 0.43%), and Liberian (12.8%, a difference of 0.44%).
DemographicsRating | RankMaster's Degree
Immigrants | Nonimmigrants
3.4
/100
|
#239
Tragic
13.3%
Guamanians/Chamorros
2.2
/100
|
#240
Tragic
13.1%
U.S. Virgin Islanders
2.1
/100
|
#241
Tragic
13.1%
Spanish Americans
1.9
/100
|
#242
Tragic
13.0%
Immigrants | Jamaica
1.9
/100
|
#243
Tragic
13.0%
Delaware
1.7
/100
|
#244
Tragic
13.0%
Immigrants | Bahamas
1.4
/100
|
#245
Tragic
12.9%
Immigrants | Cambodia
1.4
/100
|
#246
Tragic
12.9%
Iroquois
1.4
/100
|
#247
Tragic
12.9%
Africans
1.4
/100
|
#248
Tragic
12.9%
Cree
1.3
/100
|
#249
Tragic
12.8%
Liberians
1.3
/100
|
#250
Tragic
12.8%
Tlingit-Haida
1.3
/100
|
#251
Tragic
12.8%
French American Indians
1.0
/100
|
#252
Tragic
12.7%
Immigrants | Dominica
0.8
/100
|
#253
Tragic
12.6%