Austrian vs Mongolian 9th Grade
COMPARE
Austrian
Mongolian
9th Grade
9th Grade Comparison
Austrians
Mongolians
96.0%
9TH GRADE
99.8/ 100
METRIC RATING
53rd/ 347
METRIC RANK
95.0%
9TH GRADE
73.0/ 100
METRIC RATING
157th/ 347
METRIC RANK
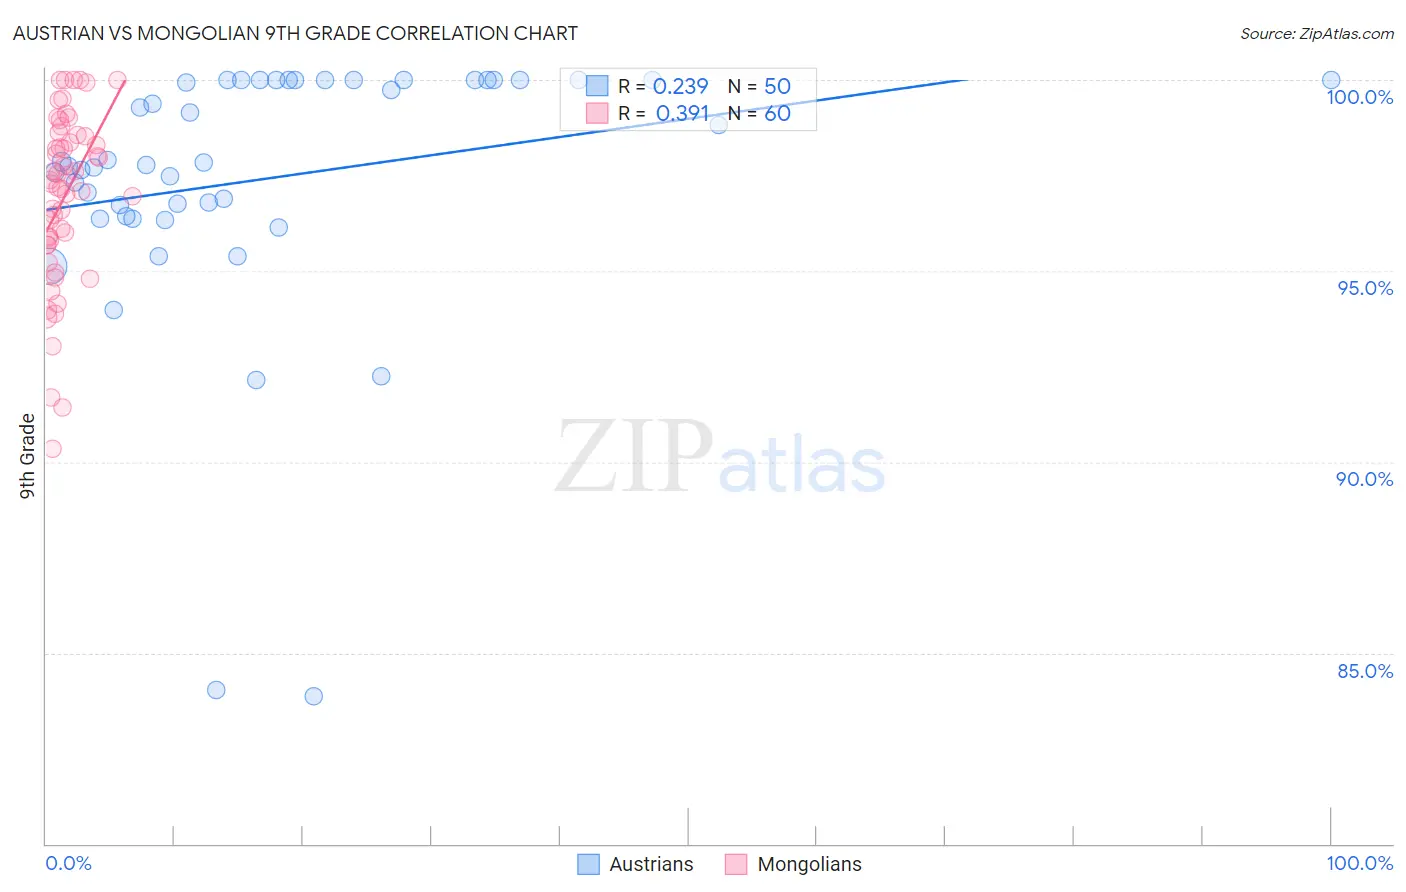
Austrian vs Mongolian 9th Grade Correlation Chart
The statistical analysis conducted on geographies consisting of 452,082,820 people shows a weak positive correlation between the proportion of Austrians and percentage of population with at least 9th grade education in the United States with a correlation coefficient (R) of 0.239 and weighted average of 96.0%. Similarly, the statistical analysis conducted on geographies consisting of 140,247,278 people shows a mild positive correlation between the proportion of Mongolians and percentage of population with at least 9th grade education in the United States with a correlation coefficient (R) of 0.391 and weighted average of 95.0%, a difference of 1.0%.
9th Grade Correlation Summary
| Measurement | Austrian | Mongolian |
| Minimum | 83.9% | 90.4% |
| Maximum | 100.0% | 100.0% |
| Range | 16.1% | 9.6% |
| Mean | 97.4% | 96.9% |
| Median | 97.8% | 97.3% |
| Interquartile 25% (IQ1) | 96.4% | 95.7% |
| Interquartile 75% (IQ3) | 100.0% | 98.6% |
| Interquartile Range (IQR) | 3.6% | 2.8% |
| Standard Deviation (Sample) | 3.4% | 2.2% |
| Standard Deviation (Population) | 3.4% | 2.2% |
Similar Demographics by 9th Grade
Demographics Similar to Austrians by 9th Grade
In terms of 9th grade, the demographic groups most similar to Austrians are Serbian (96.0%, a difference of 0.010%), Immigrants from Canada (96.0%, a difference of 0.010%), Immigrants from Northern Europe (96.0%, a difference of 0.020%), Immigrants from Austria (96.0%, a difference of 0.020%), and Celtic (96.0%, a difference of 0.030%).
| Demographics | Rating | Rank | 9th Grade |
| Immigrants | India | 99.9 /100 | #46 | Exceptional 96.1% |
| Russians | 99.9 /100 | #47 | Exceptional 96.0% |
| Australians | 99.9 /100 | #48 | Exceptional 96.0% |
| Greeks | 99.9 /100 | #49 | Exceptional 96.0% |
| Celtics | 99.9 /100 | #50 | Exceptional 96.0% |
| Immigrants | Northern Europe | 99.9 /100 | #51 | Exceptional 96.0% |
| Serbians | 99.9 /100 | #52 | Exceptional 96.0% |
| Austrians | 99.8 /100 | #53 | Exceptional 96.0% |
| Immigrants | Canada | 99.8 /100 | #54 | Exceptional 96.0% |
| Immigrants | Austria | 99.8 /100 | #55 | Exceptional 96.0% |
| Immigrants | North America | 99.8 /100 | #56 | Exceptional 96.0% |
| Macedonians | 99.8 /100 | #57 | Exceptional 96.0% |
| Aleuts | 99.8 /100 | #58 | Exceptional 96.0% |
| New Zealanders | 99.8 /100 | #59 | Exceptional 95.9% |
| Native Hawaiians | 99.8 /100 | #60 | Exceptional 95.9% |
Demographics Similar to Mongolians by 9th Grade
In terms of 9th grade, the demographic groups most similar to Mongolians are Immigrants from Kenya (95.0%, a difference of 0.0%), Arab (95.1%, a difference of 0.020%), Immigrants from Kazakhstan (95.1%, a difference of 0.020%), Albanian (95.1%, a difference of 0.030%), and Egyptian (95.0%, a difference of 0.030%).
| Demographics | Rating | Rank | 9th Grade |
| Kenyans | 79.1 /100 | #150 | Good 95.1% |
| Cajuns | 77.3 /100 | #151 | Good 95.1% |
| Ugandans | 77.0 /100 | #152 | Good 95.1% |
| Albanians | 76.1 /100 | #153 | Good 95.1% |
| Arabs | 74.9 /100 | #154 | Good 95.1% |
| Immigrants | Kazakhstan | 74.7 /100 | #155 | Good 95.1% |
| Immigrants | Kenya | 73.1 /100 | #156 | Good 95.0% |
| Mongolians | 73.0 /100 | #157 | Good 95.0% |
| Egyptians | 70.1 /100 | #158 | Good 95.0% |
| Immigrants | Ukraine | 67.4 /100 | #159 | Good 95.0% |
| Immigrants | Italy | 66.6 /100 | #160 | Good 95.0% |
| French American Indians | 66.5 /100 | #161 | Good 95.0% |
| Bermudans | 65.8 /100 | #162 | Good 95.0% |
| Pakistanis | 64.1 /100 | #163 | Good 95.0% |
| Venezuelans | 63.6 /100 | #164 | Good 95.0% |