Afghan vs Alsatian 9th Grade
COMPARE
Afghan
Alsatian
9th Grade
9th Grade Comparison
Afghans
Alsatians
94.2%
9TH GRADE
1.8/ 100
METRIC RATING
247th/ 347
METRIC RANK
94.9%
9TH GRADE
58.6/ 100
METRIC RATING
170th/ 347
METRIC RANK
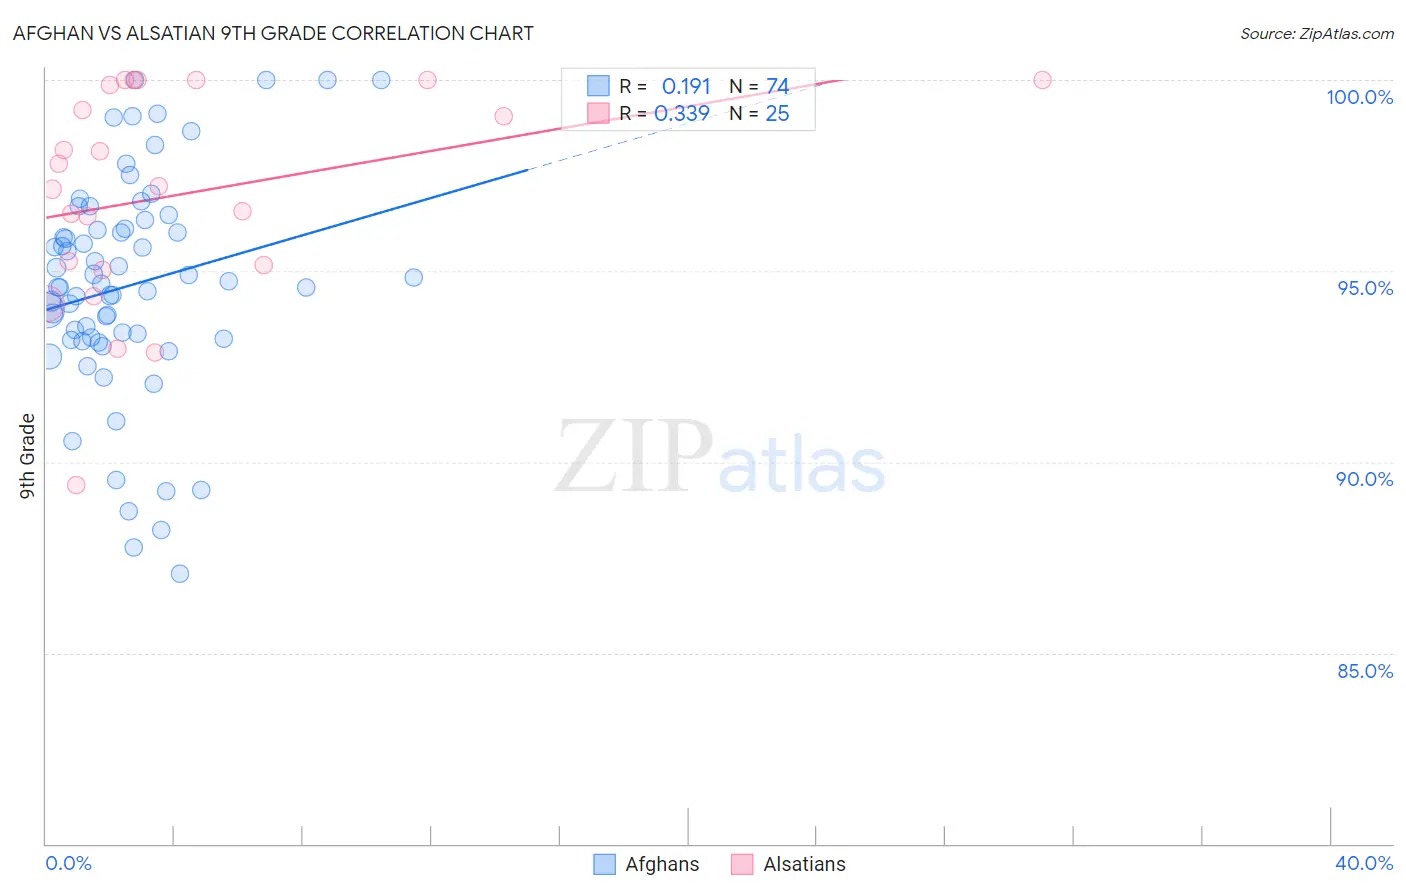
Afghan vs Alsatian 9th Grade Correlation Chart
The statistical analysis conducted on geographies consisting of 148,851,685 people shows a poor positive correlation between the proportion of Afghans and percentage of population with at least 9th grade education in the United States with a correlation coefficient (R) of 0.191 and weighted average of 94.2%. Similarly, the statistical analysis conducted on geographies consisting of 82,682,365 people shows a mild positive correlation between the proportion of Alsatians and percentage of population with at least 9th grade education in the United States with a correlation coefficient (R) of 0.339 and weighted average of 94.9%, a difference of 0.80%.
9th Grade Correlation Summary
| Measurement | Afghan | Alsatian |
| Minimum | 87.1% | 89.4% |
| Maximum | 100.0% | 100.0% |
| Range | 12.9% | 10.6% |
| Mean | 94.6% | 97.0% |
| Median | 94.6% | 97.2% |
| Interquartile 25% (IQ1) | 93.2% | 95.1% |
| Interquartile 75% (IQ3) | 96.1% | 99.9% |
| Interquartile Range (IQR) | 2.9% | 4.8% |
| Standard Deviation (Sample) | 2.9% | 2.8% |
| Standard Deviation (Population) | 2.9% | 2.8% |
Similar Demographics by 9th Grade
Demographics Similar to Afghans by 9th Grade
In terms of 9th grade, the demographic groups most similar to Afghans are Paiute (94.2%, a difference of 0.010%), Senegalese (94.2%, a difference of 0.010%), Dutch West Indian (94.2%, a difference of 0.020%), Immigrants from Middle Africa (94.2%, a difference of 0.030%), and Immigrants from Cameroon (94.2%, a difference of 0.030%).
| Demographics | Rating | Rank | 9th Grade |
| Immigrants | Ethiopia | 2.7 /100 | #240 | Tragic 94.3% |
| Spanish Americans | 2.6 /100 | #241 | Tragic 94.2% |
| Immigrants | Middle Africa | 2.2 /100 | #242 | Tragic 94.2% |
| Immigrants | Cameroon | 2.1 /100 | #243 | Tragic 94.2% |
| Dutch West Indians | 2.0 /100 | #244 | Tragic 94.2% |
| Paiute | 1.9 /100 | #245 | Tragic 94.2% |
| Senegalese | 1.9 /100 | #246 | Tragic 94.2% |
| Afghans | 1.8 /100 | #247 | Tragic 94.2% |
| Immigrants | Somalia | 1.4 /100 | #248 | Tragic 94.1% |
| Uruguayans | 1.3 /100 | #249 | Tragic 94.1% |
| Immigrants | Hong Kong | 1.3 /100 | #250 | Tragic 94.1% |
| Jamaicans | 1.0 /100 | #251 | Tragic 94.1% |
| Immigrants | Senegal | 0.9 /100 | #252 | Tragic 94.1% |
| Colombians | 0.8 /100 | #253 | Tragic 94.0% |
| U.S. Virgin Islanders | 0.7 /100 | #254 | Tragic 94.0% |
Demographics Similar to Alsatians by 9th Grade
In terms of 9th grade, the demographic groups most similar to Alsatians are Colville (94.9%, a difference of 0.0%), Spaniard (94.9%, a difference of 0.010%), Immigrants from Brazil (95.0%, a difference of 0.020%), Chilean (95.0%, a difference of 0.020%), and Blackfeet (95.0%, a difference of 0.030%).
| Demographics | Rating | Rank | 9th Grade |
| Pakistanis | 64.1 /100 | #163 | Good 95.0% |
| Venezuelans | 63.6 /100 | #164 | Good 95.0% |
| Blackfeet | 62.6 /100 | #165 | Good 95.0% |
| Ute | 62.6 /100 | #166 | Good 95.0% |
| Immigrants | Brazil | 61.1 /100 | #167 | Good 95.0% |
| Chileans | 60.7 /100 | #168 | Good 95.0% |
| Spaniards | 59.6 /100 | #169 | Average 94.9% |
| Alsatians | 58.6 /100 | #170 | Average 94.9% |
| Colville | 58.5 /100 | #171 | Average 94.9% |
| Iraqis | 54.0 /100 | #172 | Average 94.9% |
| Cheyenne | 51.5 /100 | #173 | Average 94.9% |
| Immigrants | Egypt | 50.0 /100 | #174 | Average 94.9% |
| Brazilians | 49.8 /100 | #175 | Average 94.9% |
| Immigrants | Spain | 49.1 /100 | #176 | Average 94.9% |
| Immigrants | Iraq | 47.8 /100 | #177 | Average 94.9% |