Australian vs Iraqi Disability Age 18 to 34
COMPARE
Australian
Iraqi
Disability Age 18 to 34
Disability Age 18 to 34 Comparison
Australians
Iraqis
6.8%
DISABILITY AGE 18 TO 34
19.4/ 100
METRIC RATING
198th/ 347
METRIC RANK
6.7%
DISABILITY AGE 18 TO 34
37.4/ 100
METRIC RATING
184th/ 347
METRIC RANK
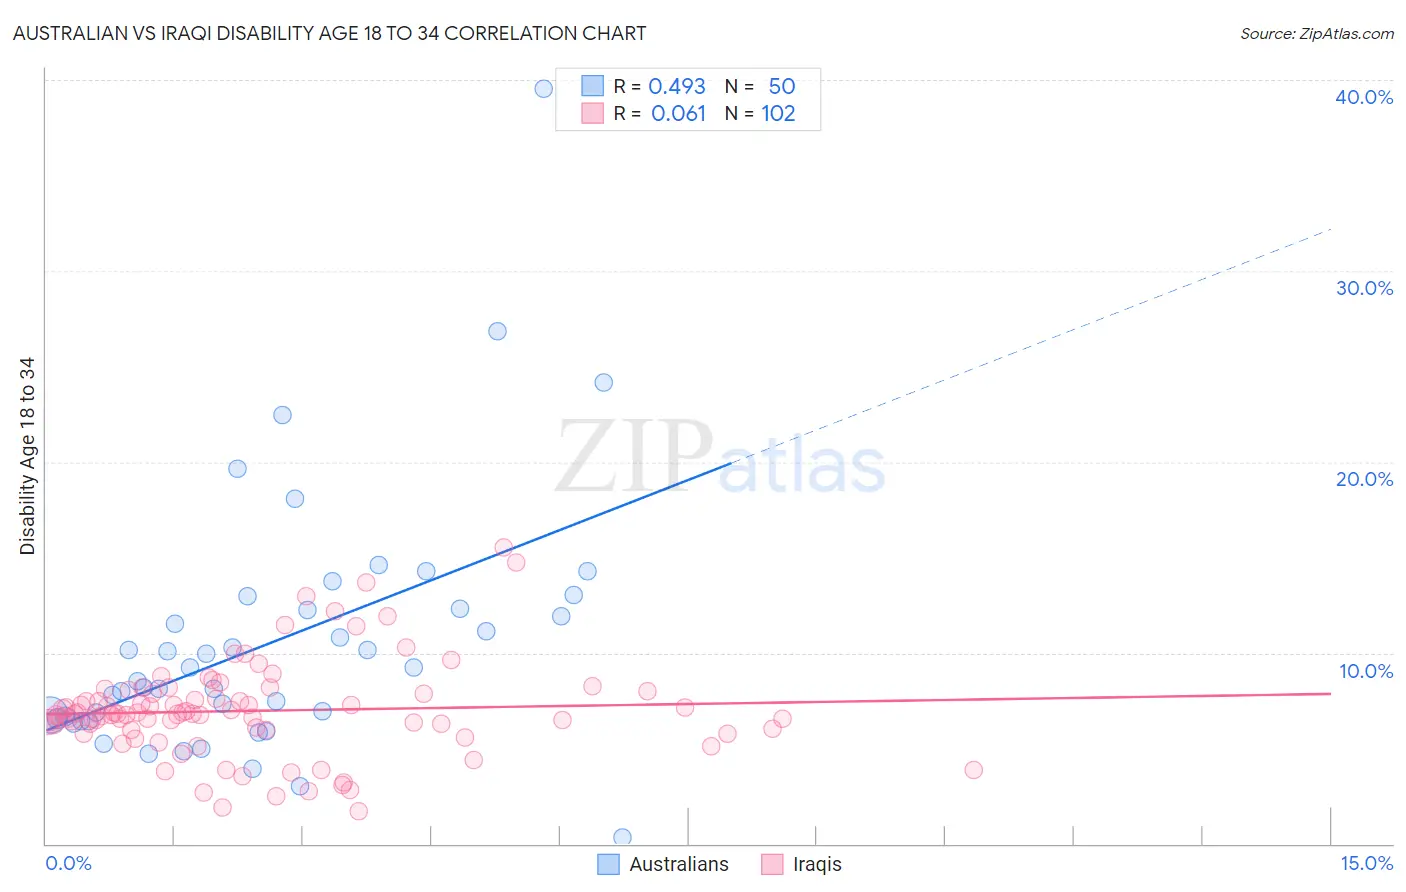
Australian vs Iraqi Disability Age 18 to 34 Correlation Chart
The statistical analysis conducted on geographies consisting of 223,842,296 people shows a moderate positive correlation between the proportion of Australians and percentage of population with a disability between the ages 18 and 35 in the United States with a correlation coefficient (R) of 0.493 and weighted average of 6.8%. Similarly, the statistical analysis conducted on geographies consisting of 170,587,063 people shows a slight positive correlation between the proportion of Iraqis and percentage of population with a disability between the ages 18 and 35 in the United States with a correlation coefficient (R) of 0.061 and weighted average of 6.7%, a difference of 1.5%.
Disability Age 18 to 34 Correlation Summary
| Measurement | Australian | Iraqi |
| Minimum | 0.32% | 1.7% |
| Maximum | 39.5% | 15.5% |
| Range | 39.2% | 13.8% |
| Mean | 10.6% | 7.0% |
| Median | 8.9% | 6.8% |
| Interquartile 25% (IQ1) | 6.6% | 6.0% |
| Interquartile 75% (IQ3) | 12.3% | 7.9% |
| Interquartile Range (IQR) | 5.7% | 1.9% |
| Standard Deviation (Sample) | 6.7% | 2.5% |
| Standard Deviation (Population) | 6.6% | 2.5% |
Demographics Similar to Australians and Iraqis by Disability Age 18 to 34
In terms of disability age 18 to 34, the demographic groups most similar to Australians are Estonian (6.8%, a difference of 0.13%), Kenyan (6.8%, a difference of 0.13%), Immigrants from Netherlands (6.7%, a difference of 0.16%), Sierra Leonean (6.8%, a difference of 0.22%), and Mexican American Indian (6.7%, a difference of 0.29%). Similarly, the demographic groups most similar to Iraqis are Immigrants from Iraq (6.7%, a difference of 0.0%), U.S. Virgin Islander (6.7%, a difference of 0.090%), Immigrants from Oceania (6.7%, a difference of 0.15%), Yup'ik (6.7%, a difference of 0.15%), and Romanian (6.6%, a difference of 0.16%).
| Demographics | Rating | Rank | Disability Age 18 to 34 |
| Romanians | 39.5 /100 | #181 | Fair 6.6% |
| U.S. Virgin Islanders | 38.6 /100 | #182 | Fair 6.7% |
| Immigrants | Iraq | 37.4 /100 | #183 | Fair 6.7% |
| Iraqis | 37.4 /100 | #184 | Fair 6.7% |
| Immigrants | Oceania | 35.4 /100 | #185 | Fair 6.7% |
| Yup'ik | 35.3 /100 | #186 | Fair 6.7% |
| Maltese | 34.8 /100 | #187 | Fair 6.7% |
| Immigrants | Cameroon | 34.5 /100 | #188 | Fair 6.7% |
| Pakistanis | 33.7 /100 | #189 | Fair 6.7% |
| Immigrants | Zimbabwe | 33.6 /100 | #190 | Fair 6.7% |
| Immigrants | Eastern Africa | 33.2 /100 | #191 | Fair 6.7% |
| Immigrants | Western Africa | 28.3 /100 | #192 | Fair 6.7% |
| Immigrants | Uganda | 25.1 /100 | #193 | Fair 6.7% |
| Immigrants | Sudan | 24.9 /100 | #194 | Fair 6.7% |
| Mexican American Indians | 22.3 /100 | #195 | Fair 6.7% |
| Immigrants | Netherlands | 21.0 /100 | #196 | Fair 6.7% |
| Estonians | 20.6 /100 | #197 | Fair 6.8% |
| Australians | 19.4 /100 | #198 | Poor 6.8% |
| Kenyans | 18.3 /100 | #199 | Poor 6.8% |
| Sierra Leoneans | 17.5 /100 | #200 | Poor 6.8% |
| Greeks | 16.1 /100 | #201 | Poor 6.8% |