Australian vs Tongan High School Diploma
COMPARE
Australian
Tongan
High School Diploma
High School Diploma Comparison
Australians
Tongans
91.2%
HIGH SCHOOL DIPLOMA
99.8/ 100
METRIC RATING
47th/ 347
METRIC RANK
88.4%
HIGH SCHOOL DIPLOMA
9.5/ 100
METRIC RATING
220th/ 347
METRIC RANK
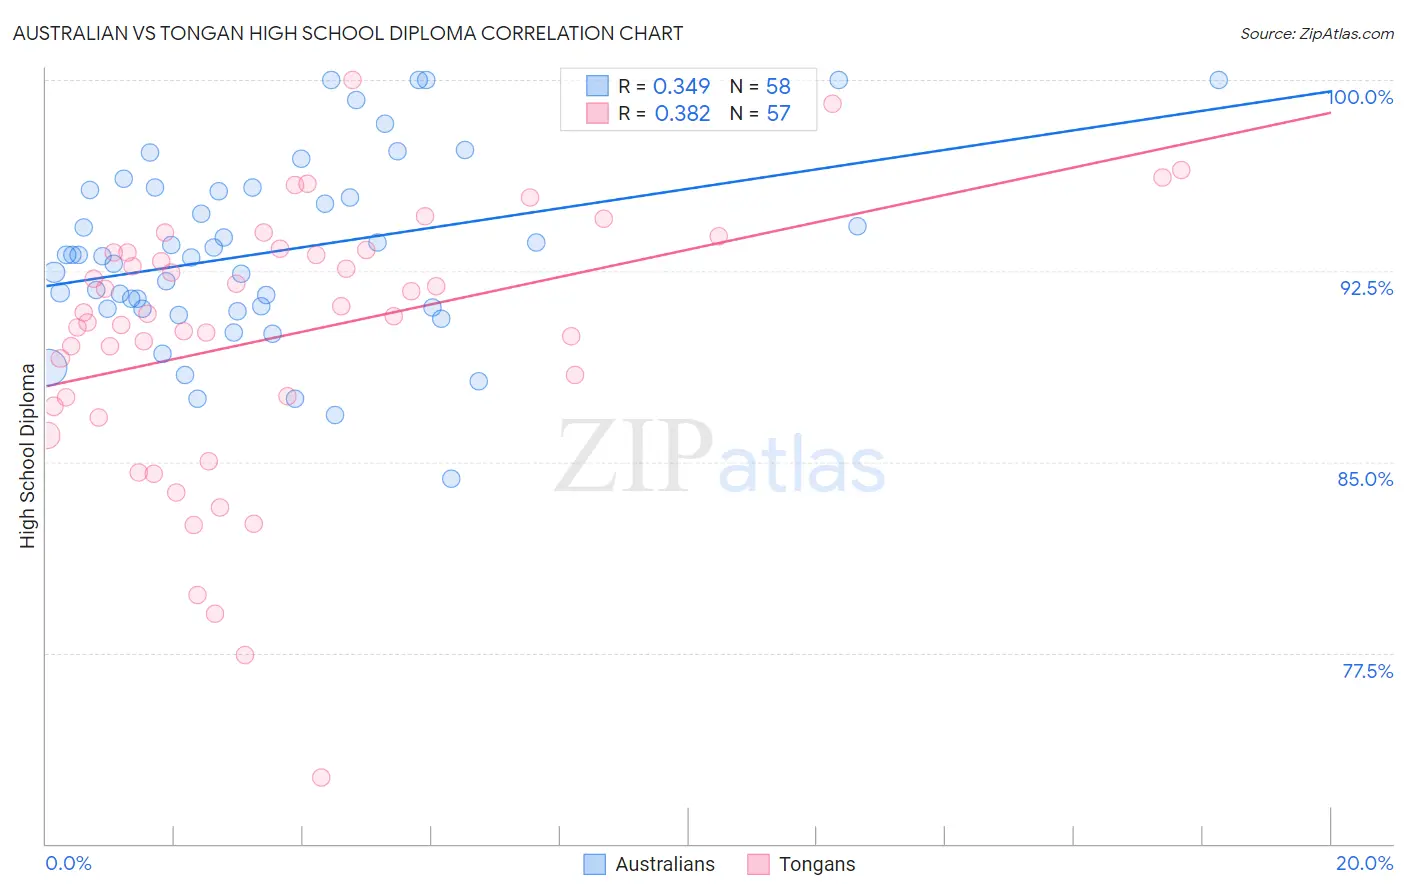
Australian vs Tongan High School Diploma Correlation Chart
The statistical analysis conducted on geographies consisting of 224,152,919 people shows a mild positive correlation between the proportion of Australians and percentage of population with at least high school diploma education in the United States with a correlation coefficient (R) of 0.349 and weighted average of 91.2%. Similarly, the statistical analysis conducted on geographies consisting of 102,904,773 people shows a mild positive correlation between the proportion of Tongans and percentage of population with at least high school diploma education in the United States with a correlation coefficient (R) of 0.382 and weighted average of 88.4%, a difference of 3.2%.
High School Diploma Correlation Summary
| Measurement | Australian | Tongan |
| Minimum | 84.3% | 72.6% |
| Maximum | 100.0% | 100.0% |
| Range | 15.7% | 27.4% |
| Mean | 93.3% | 90.0% |
| Median | 93.1% | 90.8% |
| Interquartile 25% (IQ1) | 91.0% | 87.4% |
| Interquartile 75% (IQ3) | 95.7% | 93.3% |
| Interquartile Range (IQR) | 4.7% | 5.9% |
| Standard Deviation (Sample) | 3.6% | 5.3% |
| Standard Deviation (Population) | 3.6% | 5.2% |
Similar Demographics by High School Diploma
Demographics Similar to Australians by High School Diploma
In terms of high school diploma, the demographic groups most similar to Australians are Belgian (91.2%, a difference of 0.0%), Greek (91.2%, a difference of 0.010%), Bhutanese (91.2%, a difference of 0.010%), Welsh (91.2%, a difference of 0.030%), and Immigrants from Austria (91.3%, a difference of 0.050%).
| Demographics | Rating | Rank | High School Diploma |
| Immigrants | Lithuania | 99.8 /100 | #40 | Exceptional 91.3% |
| Immigrants | Australia | 99.8 /100 | #41 | Exceptional 91.3% |
| Northern Europeans | 99.8 /100 | #42 | Exceptional 91.3% |
| British | 99.8 /100 | #43 | Exceptional 91.3% |
| Immigrants | Austria | 99.8 /100 | #44 | Exceptional 91.3% |
| Turks | 99.8 /100 | #45 | Exceptional 91.2% |
| Greeks | 99.8 /100 | #46 | Exceptional 91.2% |
| Australians | 99.8 /100 | #47 | Exceptional 91.2% |
| Belgians | 99.8 /100 | #48 | Exceptional 91.2% |
| Bhutanese | 99.8 /100 | #49 | Exceptional 91.2% |
| Welsh | 99.8 /100 | #50 | Exceptional 91.2% |
| New Zealanders | 99.7 /100 | #51 | Exceptional 91.1% |
| Immigrants | Sweden | 99.7 /100 | #52 | Exceptional 91.1% |
| Immigrants | Belgium | 99.7 /100 | #53 | Exceptional 91.1% |
| Macedonians | 99.7 /100 | #54 | Exceptional 91.1% |
Demographics Similar to Tongans by High School Diploma
In terms of high school diploma, the demographic groups most similar to Tongans are Costa Rican (88.4%, a difference of 0.0%), Immigrants from Bolivia (88.4%, a difference of 0.030%), Immigrants from Africa (88.4%, a difference of 0.040%), Immigrants from Afghanistan (88.3%, a difference of 0.040%), and Chickasaw (88.4%, a difference of 0.050%).
| Demographics | Rating | Rank | High School Diploma |
| Immigrants | Somalia | 11.3 /100 | #213 | Poor 88.4% |
| Immigrants | Cameroon | 10.9 /100 | #214 | Poor 88.4% |
| Crow | 10.9 /100 | #215 | Poor 88.4% |
| Chickasaw | 10.7 /100 | #216 | Poor 88.4% |
| Immigrants | Africa | 10.6 /100 | #217 | Poor 88.4% |
| Immigrants | Bolivia | 10.3 /100 | #218 | Poor 88.4% |
| Costa Ricans | 9.6 /100 | #219 | Tragic 88.4% |
| Tongans | 9.5 /100 | #220 | Tragic 88.4% |
| Immigrants | Afghanistan | 8.6 /100 | #221 | Tragic 88.3% |
| Colville | 7.8 /100 | #222 | Tragic 88.3% |
| Immigrants | Zaire | 7.6 /100 | #223 | Tragic 88.3% |
| Shoshone | 7.0 /100 | #224 | Tragic 88.3% |
| Creek | 6.9 /100 | #225 | Tragic 88.3% |
| Uruguayans | 5.6 /100 | #226 | Tragic 88.2% |
| Immigrants | Liberia | 5.5 /100 | #227 | Tragic 88.2% |