Dutch vs Immigrants from Sudan Bachelor's Degree
COMPARE
Dutch
Immigrants from Sudan
Bachelor's Degree
Bachelor's Degree Comparison
Dutch
Immigrants from Sudan
35.7%
BACHELOR'S DEGREE
9.2/ 100
METRIC RATING
221st/ 347
METRIC RANK
39.4%
BACHELOR'S DEGREE
84.5/ 100
METRIC RATING
139th/ 347
METRIC RANK
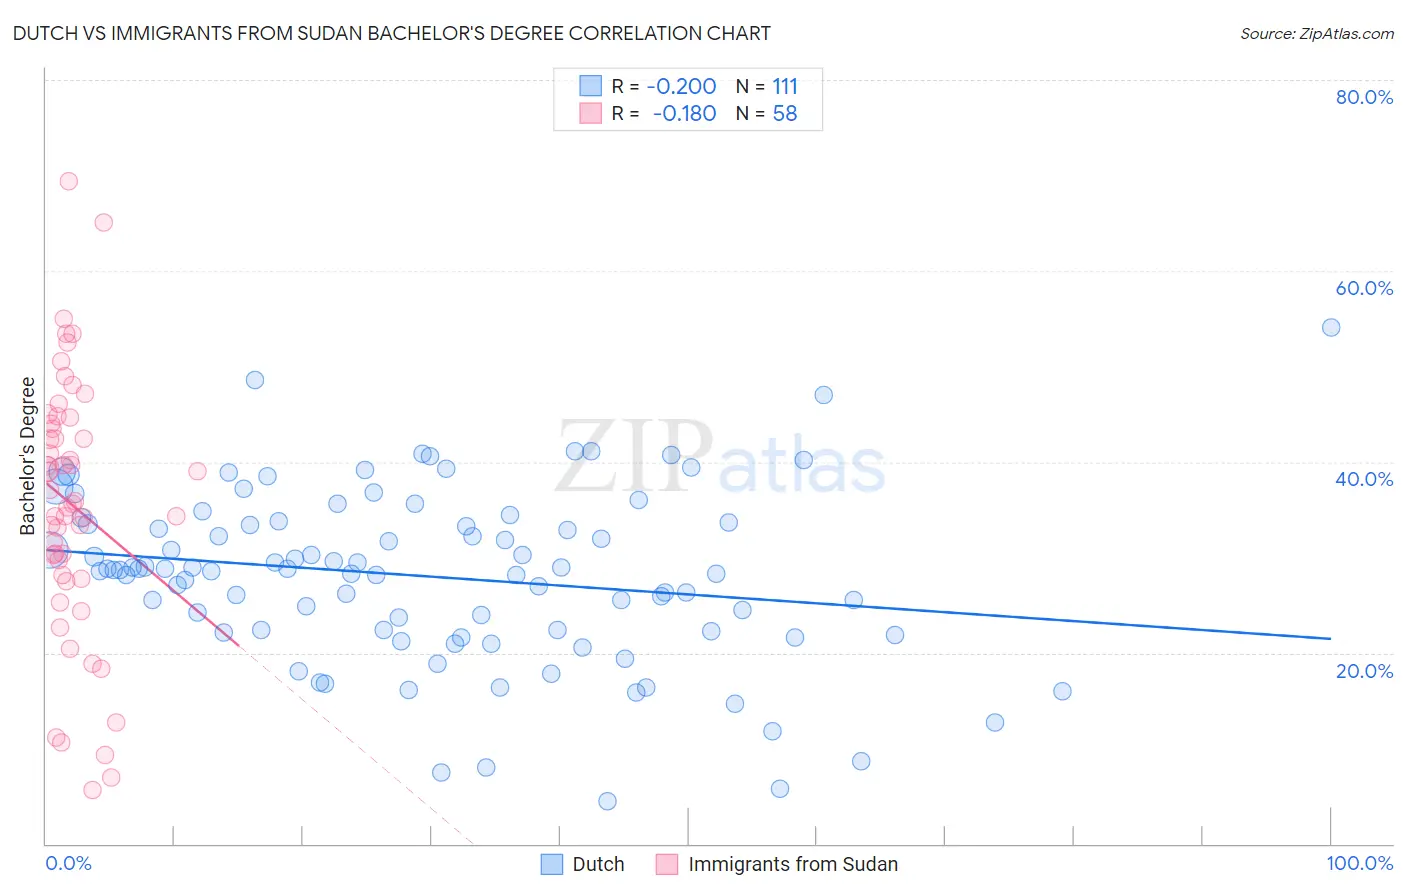
Dutch vs Immigrants from Sudan Bachelor's Degree Correlation Chart
The statistical analysis conducted on geographies consisting of 554,248,334 people shows a weak negative correlation between the proportion of Dutch and percentage of population with at least bachelor's degree education in the United States with a correlation coefficient (R) of -0.200 and weighted average of 35.7%. Similarly, the statistical analysis conducted on geographies consisting of 118,968,853 people shows a poor negative correlation between the proportion of Immigrants from Sudan and percentage of population with at least bachelor's degree education in the United States with a correlation coefficient (R) of -0.180 and weighted average of 39.4%, a difference of 10.2%.
Bachelor's Degree Correlation Summary
| Measurement | Dutch | Immigrants from Sudan |
| Minimum | 4.5% | 5.7% |
| Maximum | 54.1% | 69.4% |
| Range | 49.5% | 63.7% |
| Mean | 28.0% | 35.5% |
| Median | 28.7% | 35.7% |
| Interquartile 25% (IQ1) | 22.2% | 28.1% |
| Interquartile 75% (IQ3) | 33.7% | 44.0% |
| Interquartile Range (IQR) | 11.4% | 15.8% |
| Standard Deviation (Sample) | 9.1% | 13.6% |
| Standard Deviation (Population) | 9.0% | 13.4% |
Similar Demographics by Bachelor's Degree
Demographics Similar to Dutch by Bachelor's Degree
In terms of bachelor's degree, the demographic groups most similar to Dutch are Spanish (35.8%, a difference of 0.11%), Trinidadian and Tobagonian (35.7%, a difference of 0.14%), West Indian (35.8%, a difference of 0.15%), Subsaharan African (35.8%, a difference of 0.18%), and German Russian (35.8%, a difference of 0.28%).
| Demographics | Rating | Rank | Bachelor's Degree |
| Germans | 13.9 /100 | #214 | Poor 36.1% |
| Immigrants | Western Africa | 13.8 /100 | #215 | Poor 36.1% |
| Barbadians | 13.5 /100 | #216 | Poor 36.1% |
| German Russians | 10.2 /100 | #217 | Poor 35.8% |
| Sub-Saharan Africans | 9.8 /100 | #218 | Tragic 35.8% |
| West Indians | 9.7 /100 | #219 | Tragic 35.8% |
| Spanish | 9.6 /100 | #220 | Tragic 35.8% |
| Dutch | 9.2 /100 | #221 | Tragic 35.7% |
| Trinidadians and Tobagonians | 8.8 /100 | #222 | Tragic 35.7% |
| French Canadians | 8.3 /100 | #223 | Tragic 35.6% |
| Immigrants | Barbados | 7.5 /100 | #224 | Tragic 35.5% |
| Immigrants | Burma/Myanmar | 7.3 /100 | #225 | Tragic 35.5% |
| Portuguese | 7.2 /100 | #226 | Tragic 35.5% |
| Ecuadorians | 6.6 /100 | #227 | Tragic 35.4% |
| Immigrants | Trinidad and Tobago | 6.0 /100 | #228 | Tragic 35.3% |
Demographics Similar to Immigrants from Sudan by Bachelor's Degree
In terms of bachelor's degree, the demographic groups most similar to Immigrants from Sudan are Immigrants from Armenia (39.4%, a difference of 0.070%), South American Indian (39.3%, a difference of 0.16%), European (39.5%, a difference of 0.20%), Icelander (39.5%, a difference of 0.37%), and Immigrants from North Macedonia (39.2%, a difference of 0.48%).
| Demographics | Rating | Rank | Bachelor's Degree |
| Taiwanese | 91.1 /100 | #132 | Exceptional 40.0% |
| Immigrants | Southern Europe | 91.1 /100 | #133 | Exceptional 40.0% |
| Assyrians/Chaldeans/Syriacs | 89.4 /100 | #134 | Excellent 39.8% |
| Luxembourgers | 89.1 /100 | #135 | Excellent 39.8% |
| Pakistanis | 88.2 /100 | #136 | Excellent 39.7% |
| Icelanders | 86.5 /100 | #137 | Excellent 39.5% |
| Europeans | 85.6 /100 | #138 | Excellent 39.5% |
| Immigrants | Sudan | 84.5 /100 | #139 | Excellent 39.4% |
| Immigrants | Armenia | 84.1 /100 | #140 | Excellent 39.4% |
| South American Indians | 83.6 /100 | #141 | Excellent 39.3% |
| Immigrants | North Macedonia | 81.6 /100 | #142 | Excellent 39.2% |
| Poles | 79.8 /100 | #143 | Good 39.1% |
| Immigrants | Afghanistan | 79.7 /100 | #144 | Good 39.1% |
| Slovenes | 79.5 /100 | #145 | Good 39.1% |
| Swedes | 79.2 /100 | #146 | Good 39.1% |