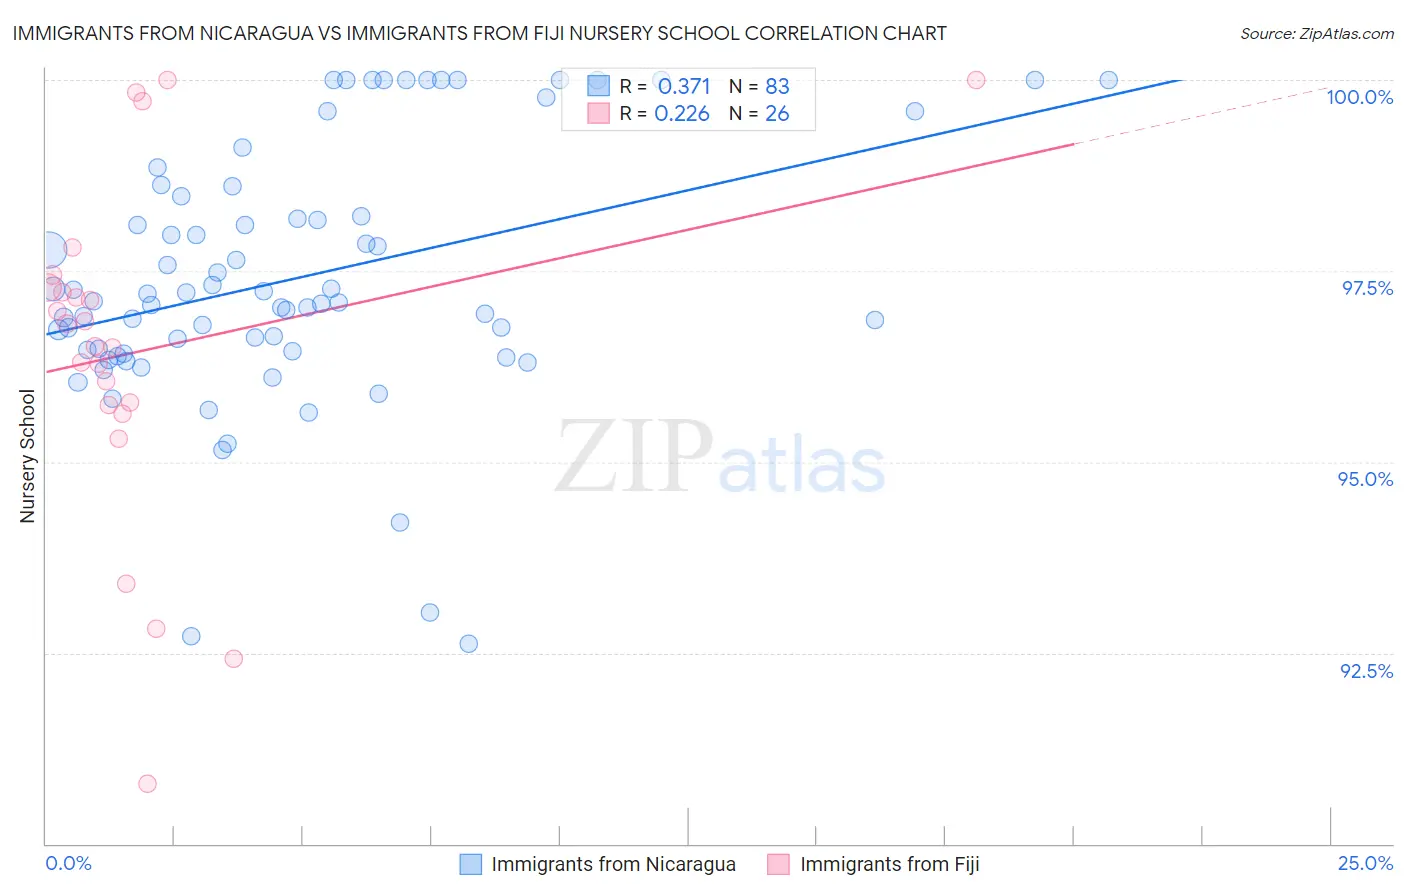
Immigrants from Nicaragua vs Immigrants from Fiji Nursery School
COMPARE
Immigrants from Nicaragua
Immigrants from Fiji
Nursery School
Nursery School Comparison
Immigrants from Nicaragua
Immigrants from Fiji
96.9%
NURSERY SCHOOL
0.0/ 100
METRIC RATING
315th/ 347
METRIC RANK
96.5%
NURSERY SCHOOL
0.0/ 100
METRIC RATING
338th/ 347
METRIC RANK
Immigrants from Nicaragua vs Immigrants from Fiji Nursery School Correlation Chart
The statistical analysis conducted on geographies consisting of 236,332,861 people shows a mild positive correlation between the proportion of Immigrants from Nicaragua and percentage of population with at least nursery school education in the United States with a correlation coefficient (R) of 0.371 and weighted average of 96.9%. Similarly, the statistical analysis conducted on geographies consisting of 93,756,204 people shows a weak positive correlation between the proportion of Immigrants from Fiji and percentage of population with at least nursery school education in the United States with a correlation coefficient (R) of 0.226 and weighted average of 96.5%, a difference of 0.44%.
Nursery School Correlation Summary
| Measurement | Immigrants from Nicaragua | Immigrants from Fiji |
| Minimum | 92.6% | 90.8% |
| Maximum | 100.0% | 100.0% |
| Range | 7.4% | 9.2% |
| Mean | 97.4% | 96.5% |
| Median | 97.1% | 96.7% |
| Interquartile 25% (IQ1) | 96.5% | 95.7% |
| Interquartile 75% (IQ3) | 98.5% | 97.3% |
| Interquartile Range (IQR) | 2.0% | 1.5% |
| Standard Deviation (Sample) | 1.7% | 2.3% |
| Standard Deviation (Population) | 1.7% | 2.2% |
Similar Demographics by Nursery School
Demographics Similar to Immigrants from Nicaragua by Nursery School
In terms of nursery school, the demographic groups most similar to Immigrants from Nicaragua are Cape Verdean (97.0%, a difference of 0.0%), Immigrants from Belize (96.9%, a difference of 0.0%), Honduran (97.0%, a difference of 0.010%), Immigrants from Ecuador (96.9%, a difference of 0.010%), and Guyanese (97.0%, a difference of 0.040%).
| Demographics | Rating | Rank | Nursery School |
| Immigrants | Haiti | 0.0 /100 | #308 | Tragic 97.0% |
| Immigrants | Somalia | 0.0 /100 | #309 | Tragic 97.0% |
| Guyanese | 0.0 /100 | #310 | Tragic 97.0% |
| Immigrants | Azores | 0.0 /100 | #311 | Tragic 97.0% |
| Sri Lankans | 0.0 /100 | #312 | Tragic 97.0% |
| Hondurans | 0.0 /100 | #313 | Tragic 97.0% |
| Cape Verdeans | 0.0 /100 | #314 | Tragic 97.0% |
| Immigrants | Nicaragua | 0.0 /100 | #315 | Tragic 96.9% |
| Immigrants | Belize | 0.0 /100 | #316 | Tragic 96.9% |
| Immigrants | Ecuador | 0.0 /100 | #317 | Tragic 96.9% |
| Immigrants | Guyana | 0.0 /100 | #318 | Tragic 96.9% |
| Immigrants | Laos | 0.0 /100 | #319 | Tragic 96.9% |
| Immigrants | Burma/Myanmar | 0.0 /100 | #320 | Tragic 96.9% |
| Immigrants | Bangladesh | 0.0 /100 | #321 | Tragic 96.9% |
| Mexican American Indians | 0.0 /100 | #322 | Tragic 96.9% |
Demographics Similar to Immigrants from Fiji by Nursery School
In terms of nursery school, the demographic groups most similar to Immigrants from Fiji are Immigrants from Cambodia (96.5%, a difference of 0.0%), Guatemalan (96.6%, a difference of 0.040%), Bangladeshi (96.6%, a difference of 0.070%), Immigrants from Guatemala (96.4%, a difference of 0.080%), and Immigrants from Dominican Republic (96.6%, a difference of 0.090%).
| Demographics | Rating | Rank | Nursery School |
| Immigrants | Armenia | 0.0 /100 | #331 | Tragic 96.7% |
| Yakama | 0.0 /100 | #332 | Tragic 96.6% |
| Central Americans | 0.0 /100 | #333 | Tragic 96.6% |
| Immigrants | Dominican Republic | 0.0 /100 | #334 | Tragic 96.6% |
| Bangladeshis | 0.0 /100 | #335 | Tragic 96.6% |
| Guatemalans | 0.0 /100 | #336 | Tragic 96.6% |
| Immigrants | Cambodia | 0.0 /100 | #337 | Tragic 96.5% |
| Immigrants | Fiji | 0.0 /100 | #338 | Tragic 96.5% |
| Immigrants | Guatemala | 0.0 /100 | #339 | Tragic 96.4% |
| Immigrants | Central America | 0.0 /100 | #340 | Tragic 96.4% |
| Immigrants | Cabo Verde | 0.0 /100 | #341 | Tragic 96.4% |
| Immigrants | Mexico | 0.0 /100 | #342 | Tragic 96.4% |
| Salvadorans | 0.0 /100 | #343 | Tragic 96.4% |
| Immigrants | El Salvador | 0.0 /100 | #344 | Tragic 96.2% |
| Nepalese | 0.0 /100 | #345 | Tragic 96.2% |