Assyrian/Chaldean/Syriac vs Estonian 5th Grade
COMPARE
Assyrian/Chaldean/Syriac
Estonian
5th Grade
5th Grade Comparison
Assyrians/Chaldeans/Syriacs
Estonians
97.0%
5TH GRADE
4.5/ 100
METRIC RATING
228th/ 347
METRIC RANK
98.0%
5TH GRADE
99.8/ 100
METRIC RATING
49th/ 347
METRIC RANK
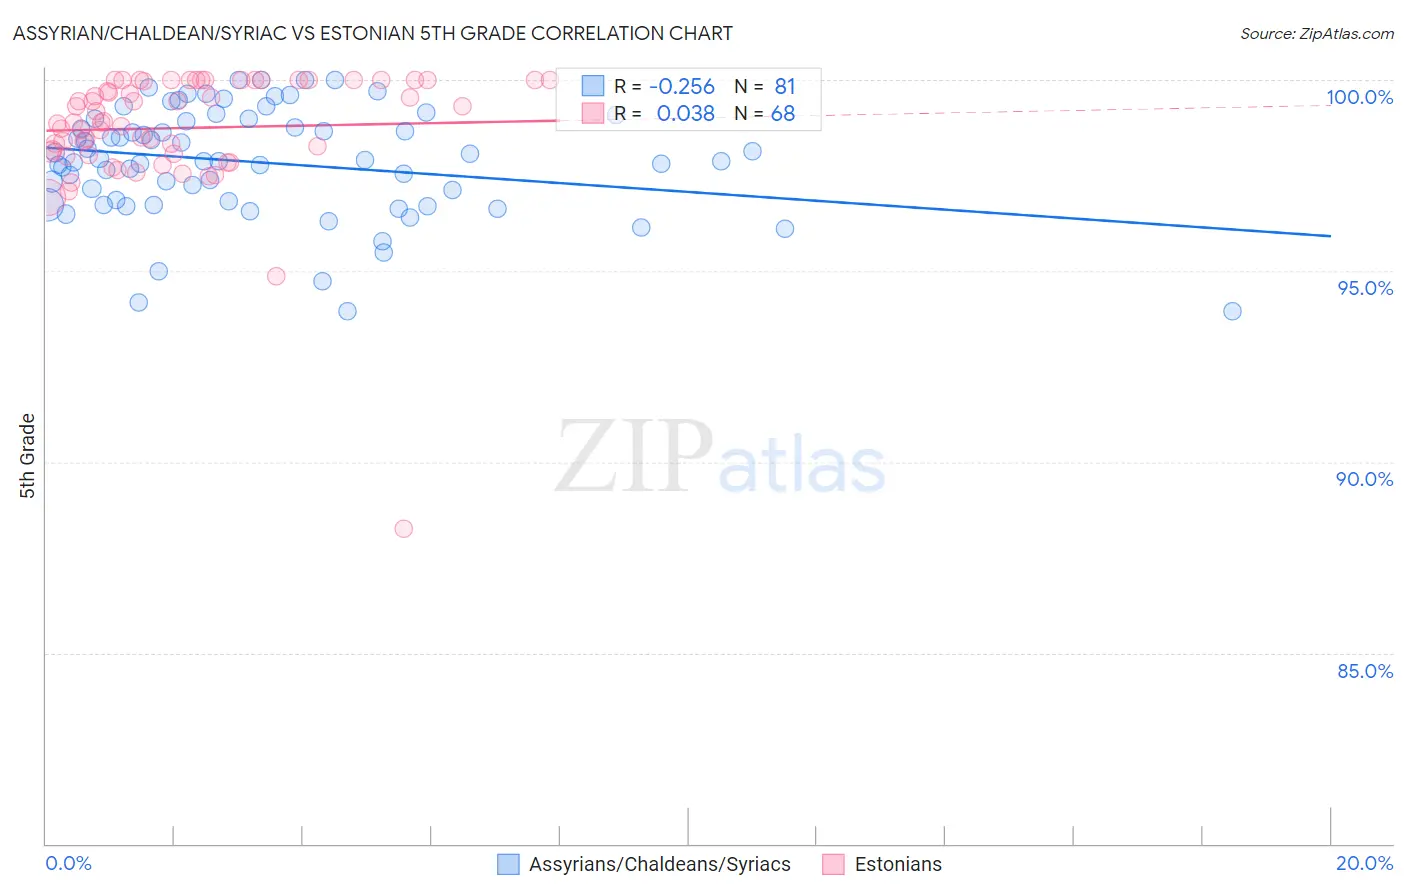
Assyrian/Chaldean/Syriac vs Estonian 5th Grade Correlation Chart
The statistical analysis conducted on geographies consisting of 110,318,304 people shows a weak negative correlation between the proportion of Assyrians/Chaldeans/Syriacs and percentage of population with at least 5th grade education in the United States with a correlation coefficient (R) of -0.256 and weighted average of 97.0%. Similarly, the statistical analysis conducted on geographies consisting of 123,528,404 people shows no correlation between the proportion of Estonians and percentage of population with at least 5th grade education in the United States with a correlation coefficient (R) of 0.038 and weighted average of 98.0%, a difference of 0.99%.
5th Grade Correlation Summary
| Measurement | Assyrian/Chaldean/Syriac | Estonian |
| Minimum | 93.9% | 88.3% |
| Maximum | 100.0% | 100.0% |
| Range | 6.1% | 11.7% |
| Mean | 97.8% | 98.7% |
| Median | 97.9% | 98.9% |
| Interquartile 25% (IQ1) | 96.8% | 98.1% |
| Interquartile 75% (IQ3) | 98.9% | 100.0% |
| Interquartile Range (IQR) | 2.2% | 1.9% |
| Standard Deviation (Sample) | 1.4% | 1.7% |
| Standard Deviation (Population) | 1.4% | 1.7% |
Similar Demographics by 5th Grade
Demographics Similar to Assyrians/Chaldeans/Syriacs by 5th Grade
In terms of 5th grade, the demographic groups most similar to Assyrians/Chaldeans/Syriacs are Yuman (97.0%, a difference of 0.0%), Immigrants from Western Asia (97.0%, a difference of 0.0%), Immigrants from Pakistan (97.0%, a difference of 0.010%), Immigrants from Malaysia (97.0%, a difference of 0.010%), and Immigrants from Eastern Asia (97.0%, a difference of 0.010%).
| Demographics | Rating | Rank | 5th Grade |
| Sierra Leoneans | 6.0 /100 | #221 | Tragic 97.1% |
| Immigrants | Panama | 5.7 /100 | #222 | Tragic 97.0% |
| Liberians | 5.7 /100 | #223 | Tragic 97.0% |
| South American Indians | 5.4 /100 | #224 | Tragic 97.0% |
| Bahamians | 5.3 /100 | #225 | Tragic 97.0% |
| Tongans | 5.3 /100 | #226 | Tragic 97.0% |
| Immigrants | Pakistan | 4.7 /100 | #227 | Tragic 97.0% |
| Assyrians/Chaldeans/Syriacs | 4.5 /100 | #228 | Tragic 97.0% |
| Yuman | 4.5 /100 | #229 | Tragic 97.0% |
| Immigrants | Western Asia | 4.3 /100 | #230 | Tragic 97.0% |
| Immigrants | Malaysia | 4.1 /100 | #231 | Tragic 97.0% |
| Immigrants | Eastern Asia | 4.0 /100 | #232 | Tragic 97.0% |
| Sub-Saharan Africans | 3.3 /100 | #233 | Tragic 97.0% |
| Tohono O'odham | 3.2 /100 | #234 | Tragic 97.0% |
| Uruguayans | 3.2 /100 | #235 | Tragic 97.0% |
Demographics Similar to Estonians by 5th Grade
In terms of 5th grade, the demographic groups most similar to Estonians are Immigrants from Scotland (98.0%, a difference of 0.0%), Celtic (98.0%, a difference of 0.0%), Bulgarian (98.0%, a difference of 0.010%), Maltese (98.0%, a difference of 0.010%), and Slavic (98.0%, a difference of 0.010%).
| Demographics | Rating | Rank | 5th Grade |
| Northern Europeans | 99.9 /100 | #42 | Exceptional 98.0% |
| Ottawa | 99.9 /100 | #43 | Exceptional 98.0% |
| Aleuts | 99.9 /100 | #44 | Exceptional 98.0% |
| Czechoslovakians | 99.9 /100 | #45 | Exceptional 98.0% |
| Arapaho | 99.9 /100 | #46 | Exceptional 98.0% |
| Native Hawaiians | 99.9 /100 | #47 | Exceptional 98.0% |
| Bulgarians | 99.8 /100 | #48 | Exceptional 98.0% |
| Estonians | 99.8 /100 | #49 | Exceptional 98.0% |
| Immigrants | Scotland | 99.8 /100 | #50 | Exceptional 98.0% |
| Celtics | 99.8 /100 | #51 | Exceptional 98.0% |
| Maltese | 99.8 /100 | #52 | Exceptional 98.0% |
| Slavs | 99.8 /100 | #53 | Exceptional 98.0% |
| Australians | 99.8 /100 | #54 | Exceptional 98.0% |
| Creek | 99.8 /100 | #55 | Exceptional 98.0% |
| Greeks | 99.8 /100 | #56 | Exceptional 97.9% |