Austrian vs Thai No Schooling Completed
COMPARE
Austrian
Thai
No Schooling Completed
No Schooling Completed Comparison
Austrians
Thais
1.6%
NO SCHOOLING COMPLETED
99.8/ 100
METRIC RATING
57th/ 347
METRIC RANK
1.8%
NO SCHOOLING COMPLETED
97.5/ 100
METRIC RATING
104th/ 347
METRIC RANK
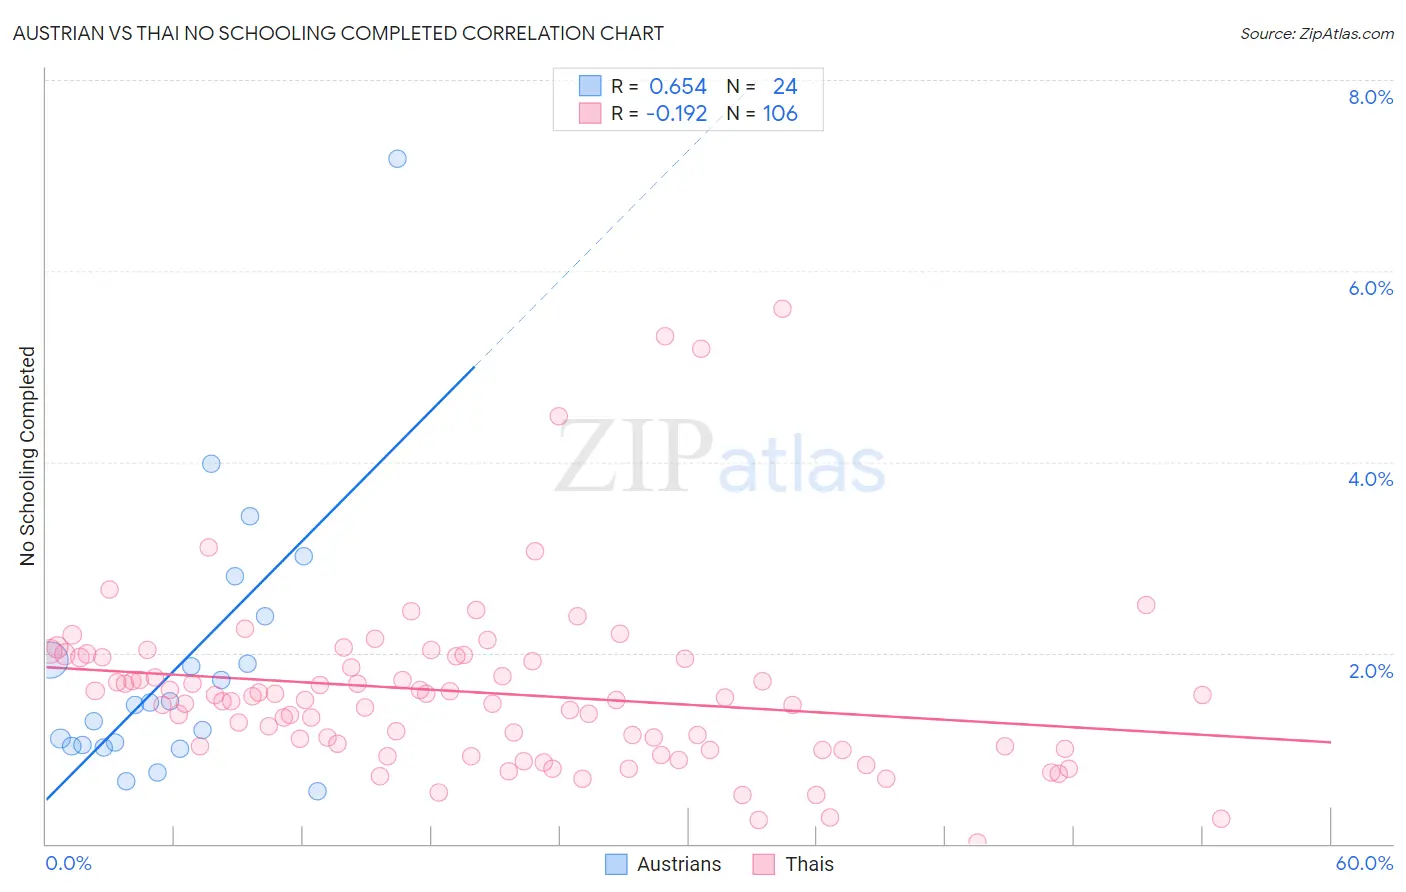
Austrian vs Thai No Schooling Completed Correlation Chart
The statistical analysis conducted on geographies consisting of 443,991,525 people shows a significant positive correlation between the proportion of Austrians and percentage of population with no schooling in the United States with a correlation coefficient (R) of 0.654 and weighted average of 1.6%. Similarly, the statistical analysis conducted on geographies consisting of 469,412,663 people shows a poor negative correlation between the proportion of Thais and percentage of population with no schooling in the United States with a correlation coefficient (R) of -0.192 and weighted average of 1.8%, a difference of 11.3%.
No Schooling Completed Correlation Summary
| Measurement | Austrian | Thai |
| Minimum | 0.55% | 0.015% |
| Maximum | 7.2% | 5.6% |
| Range | 6.6% | 5.6% |
| Mean | 1.9% | 1.6% |
| Median | 1.5% | 1.5% |
| Interquartile 25% (IQ1) | 1.0% | 1.0% |
| Interquartile 75% (IQ3) | 2.2% | 2.0% |
| Interquartile Range (IQR) | 1.1% | 0.95% |
| Standard Deviation (Sample) | 1.4% | 0.92% |
| Standard Deviation (Population) | 1.4% | 0.92% |
Similar Demographics by No Schooling Completed
Demographics Similar to Austrians by No Schooling Completed
In terms of no schooling completed, the demographic groups most similar to Austrians are Kiowa (1.6%, a difference of 0.16%), Slavic (1.7%, a difference of 0.23%), Greek (1.6%, a difference of 0.31%), Immigrants from North America (1.6%, a difference of 0.31%), and American (1.7%, a difference of 0.35%).
| Demographics | Rating | Rank | No Schooling Completed |
| Celtics | 99.9 /100 | #50 | Exceptional 1.6% |
| Chippewa | 99.8 /100 | #51 | Exceptional 1.6% |
| Immigrants | Canada | 99.8 /100 | #52 | Exceptional 1.6% |
| Creek | 99.8 /100 | #53 | Exceptional 1.6% |
| Crow | 99.8 /100 | #54 | Exceptional 1.6% |
| Greeks | 99.8 /100 | #55 | Exceptional 1.6% |
| Immigrants | North America | 99.8 /100 | #56 | Exceptional 1.6% |
| Austrians | 99.8 /100 | #57 | Exceptional 1.6% |
| Kiowa | 99.8 /100 | #58 | Exceptional 1.6% |
| Slavs | 99.8 /100 | #59 | Exceptional 1.7% |
| Americans | 99.8 /100 | #60 | Exceptional 1.7% |
| Tsimshian | 99.8 /100 | #61 | Exceptional 1.7% |
| Immigrants | Northern Europe | 99.8 /100 | #62 | Exceptional 1.7% |
| Russians | 99.8 /100 | #63 | Exceptional 1.7% |
| New Zealanders | 99.7 /100 | #64 | Exceptional 1.7% |
Demographics Similar to Thais by No Schooling Completed
In terms of no schooling completed, the demographic groups most similar to Thais are German Russian (1.8%, a difference of 0.020%), Immigrants from France (1.8%, a difference of 0.42%), Yugoslavian (1.8%, a difference of 0.46%), Basque (1.8%, a difference of 0.57%), and Immigrants from Czechoslovakia (1.8%, a difference of 0.63%).
| Demographics | Rating | Rank | No Schooling Completed |
| Immigrants | Ireland | 98.4 /100 | #97 | Exceptional 1.8% |
| Iranians | 98.2 /100 | #98 | Exceptional 1.8% |
| Choctaw | 98.1 /100 | #99 | Exceptional 1.8% |
| Immigrants | Singapore | 98.0 /100 | #100 | Exceptional 1.8% |
| Immigrants | Czechoslovakia | 97.9 /100 | #101 | Exceptional 1.8% |
| Immigrants | Switzerland | 97.9 /100 | #102 | Exceptional 1.8% |
| Basques | 97.9 /100 | #103 | Exceptional 1.8% |
| Thais | 97.5 /100 | #104 | Exceptional 1.8% |
| German Russians | 97.5 /100 | #105 | Exceptional 1.8% |
| Immigrants | France | 97.3 /100 | #106 | Exceptional 1.8% |
| Yugoslavians | 97.2 /100 | #107 | Exceptional 1.8% |
| Okinawans | 97.1 /100 | #108 | Exceptional 1.8% |
| Immigrants | Saudi Arabia | 96.8 /100 | #109 | Exceptional 1.9% |
| Immigrants | Latvia | 96.7 /100 | #110 | Exceptional 1.9% |
| Immigrants | Japan | 96.6 /100 | #111 | Exceptional 1.9% |