Asian vs Immigrants from Costa Rica 1st Grade
COMPARE
Asian
Immigrants from Costa Rica
1st Grade
1st Grade Comparison
Asians
Immigrants from Costa Rica
97.6%
1ST GRADE
1.1/ 100
METRIC RATING
244th/ 347
METRIC RANK
97.7%
1ST GRADE
3.5/ 100
METRIC RATING
229th/ 347
METRIC RANK
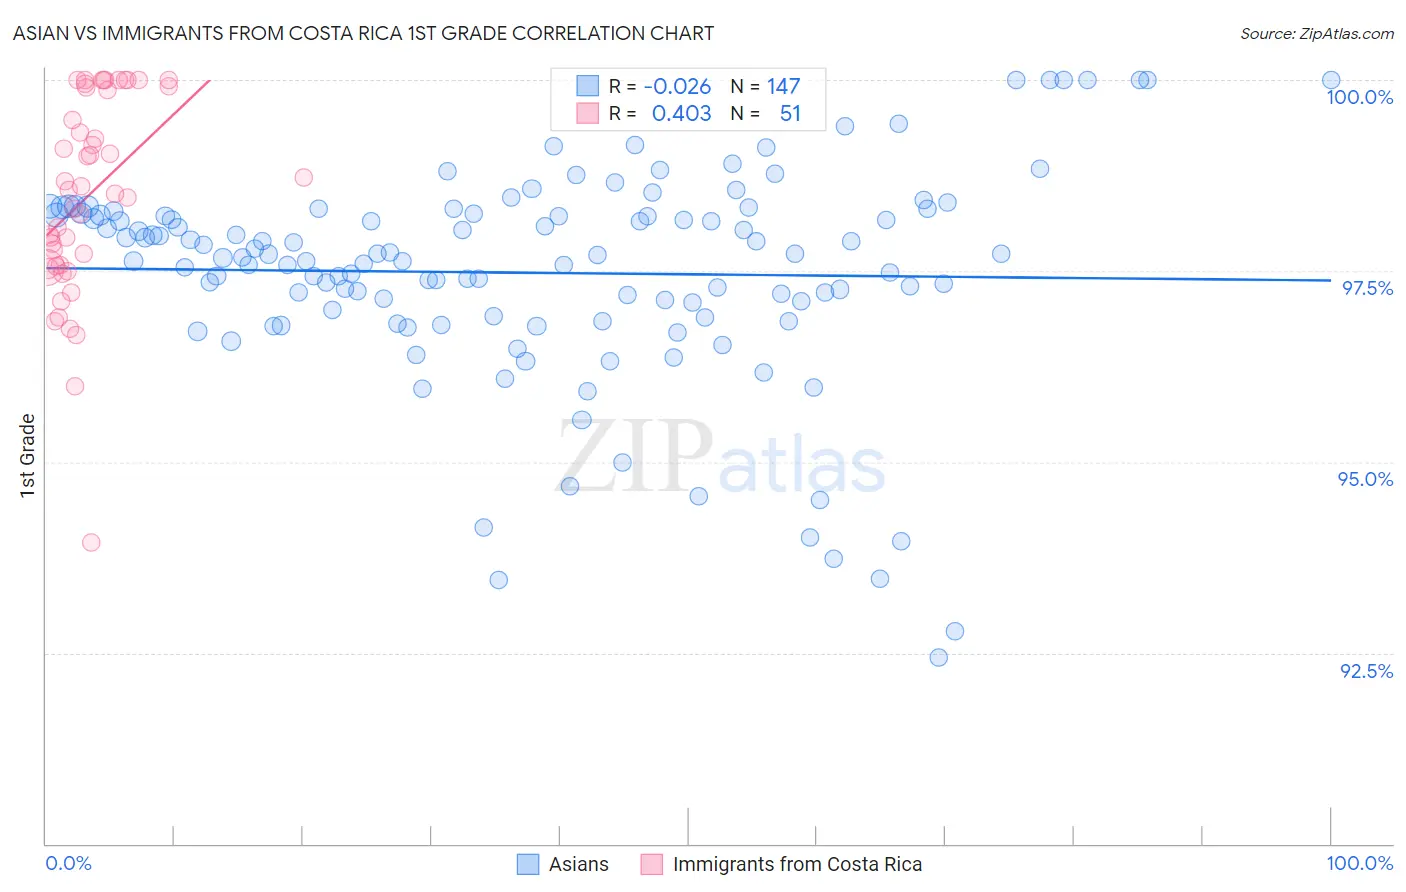
Asian vs Immigrants from Costa Rica 1st Grade Correlation Chart
The statistical analysis conducted on geographies consisting of 550,722,447 people shows no correlation between the proportion of Asians and percentage of population with at least 1st grade education in the United States with a correlation coefficient (R) of -0.026 and weighted average of 97.6%. Similarly, the statistical analysis conducted on geographies consisting of 204,275,869 people shows a moderate positive correlation between the proportion of Immigrants from Costa Rica and percentage of population with at least 1st grade education in the United States with a correlation coefficient (R) of 0.403 and weighted average of 97.7%, a difference of 0.090%.
1st Grade Correlation Summary
| Measurement | Asian | Immigrants from Costa Rica |
| Minimum | 92.4% | 93.9% |
| Maximum | 100.0% | 100.0% |
| Range | 7.6% | 6.1% |
| Mean | 97.5% | 98.5% |
| Median | 97.7% | 98.6% |
| Interquartile 25% (IQ1) | 96.9% | 97.6% |
| Interquartile 75% (IQ3) | 98.2% | 99.9% |
| Interquartile Range (IQR) | 1.3% | 2.3% |
| Standard Deviation (Sample) | 1.4% | 1.3% |
| Standard Deviation (Population) | 1.4% | 1.3% |
Demographics Similar to Asians and Immigrants from Costa Rica by 1st Grade
In terms of 1st grade, the demographic groups most similar to Asians are South American (97.6%, a difference of 0.0%), Immigrants from Eastern Africa (97.6%, a difference of 0.0%), Immigrants from Indonesia (97.6%, a difference of 0.010%), Bolivian (97.6%, a difference of 0.010%), and Korean (97.6%, a difference of 0.020%). Similarly, the demographic groups most similar to Immigrants from Costa Rica are Sudanese (97.7%, a difference of 0.0%), Sierra Leonean (97.7%, a difference of 0.0%), Subsaharan African (97.7%, a difference of 0.0%), Senegalese (97.7%, a difference of 0.0%), and Puerto Rican (97.7%, a difference of 0.010%).
| Demographics | Rating | Rank | 1st Grade |
| Sudanese | 3.7 /100 | #226 | Tragic 97.7% |
| Sierra Leoneans | 3.6 /100 | #227 | Tragic 97.7% |
| Sub-Saharan Africans | 3.6 /100 | #228 | Tragic 97.7% |
| Immigrants | Costa Rica | 3.5 /100 | #229 | Tragic 97.7% |
| Senegalese | 3.5 /100 | #230 | Tragic 97.7% |
| Puerto Ricans | 3.0 /100 | #231 | Tragic 97.7% |
| Immigrants | Uruguay | 2.5 /100 | #232 | Tragic 97.6% |
| Immigrants | Pakistan | 2.2 /100 | #233 | Tragic 97.6% |
| Colombians | 2.2 /100 | #234 | Tragic 97.6% |
| Immigrants | Malaysia | 2.1 /100 | #235 | Tragic 97.6% |
| Immigrants | Western Asia | 2.1 /100 | #236 | Tragic 97.6% |
| U.S. Virgin Islanders | 1.9 /100 | #237 | Tragic 97.6% |
| Nigerians | 1.8 /100 | #238 | Tragic 97.6% |
| Immigrants | Eastern Asia | 1.6 /100 | #239 | Tragic 97.6% |
| Koreans | 1.5 /100 | #240 | Tragic 97.6% |
| Liberians | 1.4 /100 | #241 | Tragic 97.6% |
| Immigrants | Indonesia | 1.2 /100 | #242 | Tragic 97.6% |
| Bolivians | 1.2 /100 | #243 | Tragic 97.6% |
| Asians | 1.1 /100 | #244 | Tragic 97.6% |
| South Americans | 1.1 /100 | #245 | Tragic 97.6% |
| Immigrants | Eastern Africa | 1.0 /100 | #246 | Tragic 97.6% |