Apache vs Immigrants from Somalia 1st Grade
COMPARE
Apache
Immigrants from Somalia
1st Grade
1st Grade Comparison
Apache
Immigrants from Somalia
98.0%
1ST GRADE
75.2/ 100
METRIC RATING
148th/ 347
METRIC RANK
96.9%
1ST GRADE
0.0/ 100
METRIC RATING
307th/ 347
METRIC RANK
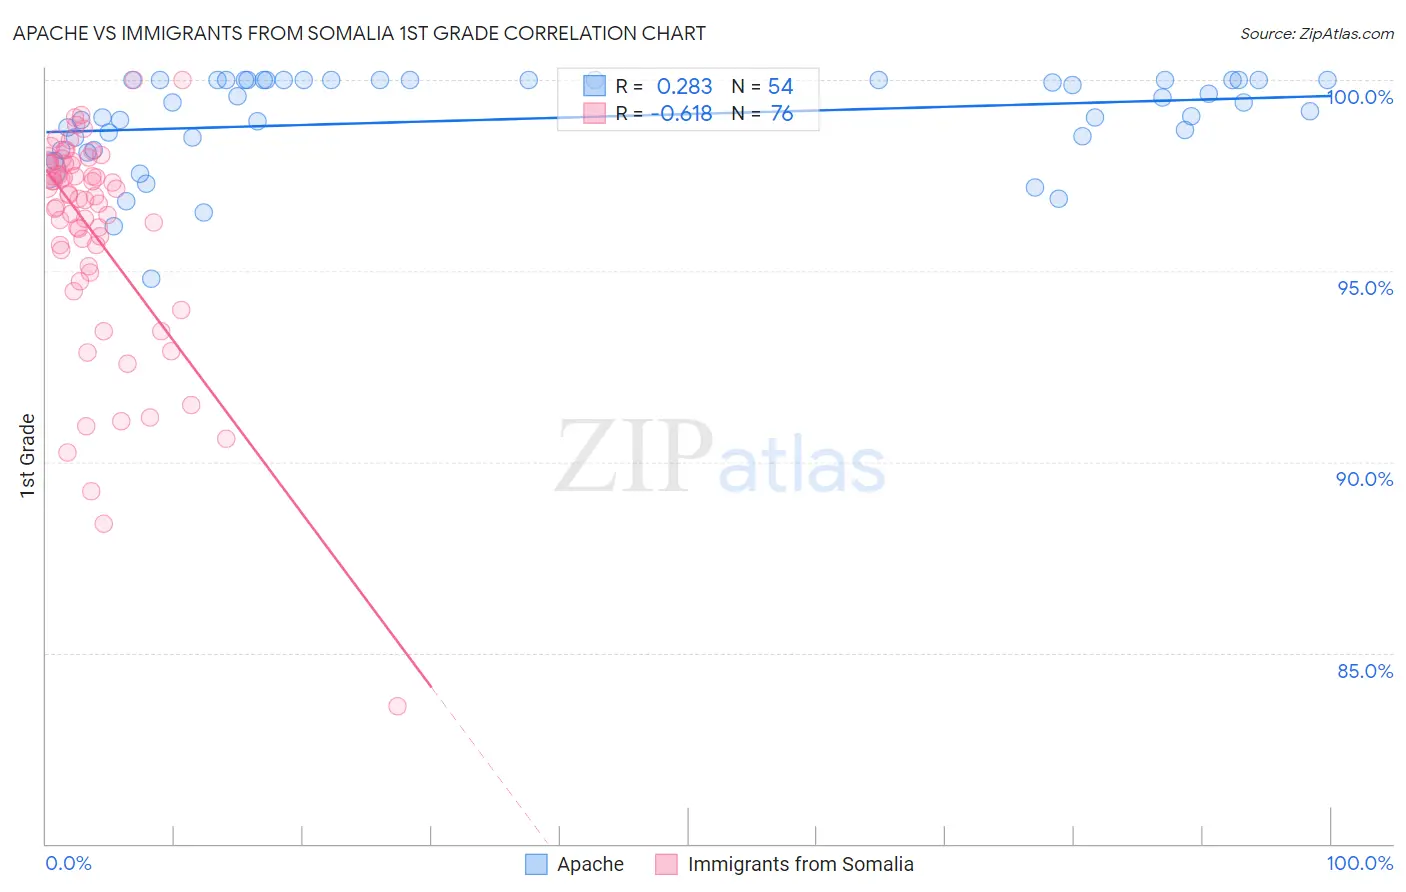
Apache vs Immigrants from Somalia 1st Grade Correlation Chart
The statistical analysis conducted on geographies consisting of 231,142,814 people shows a weak positive correlation between the proportion of Apache and percentage of population with at least 1st grade education in the United States with a correlation coefficient (R) of 0.283 and weighted average of 98.0%. Similarly, the statistical analysis conducted on geographies consisting of 92,111,755 people shows a significant negative correlation between the proportion of Immigrants from Somalia and percentage of population with at least 1st grade education in the United States with a correlation coefficient (R) of -0.618 and weighted average of 96.9%, a difference of 1.1%.
1st Grade Correlation Summary
| Measurement | Apache | Immigrants from Somalia |
| Minimum | 94.8% | 83.6% |
| Maximum | 100.0% | 100.0% |
| Range | 5.2% | 16.4% |
| Mean | 99.0% | 96.0% |
| Median | 99.4% | 97.0% |
| Interquartile 25% (IQ1) | 98.5% | 95.3% |
| Interquartile 75% (IQ3) | 100.0% | 97.8% |
| Interquartile Range (IQR) | 1.5% | 2.5% |
| Standard Deviation (Sample) | 1.2% | 2.9% |
| Standard Deviation (Population) | 1.2% | 2.9% |
Similar Demographics by 1st Grade
Demographics Similar to Apache by 1st Grade
In terms of 1st grade, the demographic groups most similar to Apache are Immigrants from Greece (98.0%, a difference of 0.0%), Immigrants from Israel (98.0%, a difference of 0.010%), Filipino (98.0%, a difference of 0.010%), Jordanian (98.0%, a difference of 0.010%), and Hmong (98.0%, a difference of 0.020%).
| Demographics | Rating | Rank | 1st Grade |
| Immigrants | Turkey | 82.8 /100 | #141 | Excellent 98.0% |
| Marshallese | 82.0 /100 | #142 | Excellent 98.0% |
| Burmese | 81.0 /100 | #143 | Excellent 98.0% |
| Alsatians | 80.9 /100 | #144 | Excellent 98.0% |
| Hmong | 79.0 /100 | #145 | Good 98.0% |
| Immigrants | Israel | 77.8 /100 | #146 | Good 98.0% |
| Filipinos | 77.6 /100 | #147 | Good 98.0% |
| Apache | 75.2 /100 | #148 | Good 98.0% |
| Immigrants | Greece | 74.9 /100 | #149 | Good 98.0% |
| Jordanians | 72.7 /100 | #150 | Good 98.0% |
| Dutch West Indians | 69.8 /100 | #151 | Good 98.0% |
| Immigrants | Moldova | 69.5 /100 | #152 | Good 98.0% |
| Soviet Union | 68.9 /100 | #153 | Good 98.0% |
| Immigrants | Iran | 66.9 /100 | #154 | Good 98.0% |
| Comanche | 66.9 /100 | #155 | Good 98.0% |
Demographics Similar to Immigrants from Somalia by 1st Grade
In terms of 1st grade, the demographic groups most similar to Immigrants from Somalia are Hispanic or Latino (96.9%, a difference of 0.0%), Belizean (96.9%, a difference of 0.010%), Immigrants from Haiti (96.9%, a difference of 0.010%), Immigrants from the Azores (96.9%, a difference of 0.010%), and Sri Lankan (96.9%, a difference of 0.030%).
| Demographics | Rating | Rank | 1st Grade |
| Haitians | 0.0 /100 | #300 | Tragic 97.1% |
| Immigrants | South Eastern Asia | 0.0 /100 | #301 | Tragic 97.1% |
| Immigrants | Caribbean | 0.0 /100 | #302 | Tragic 97.0% |
| Somalis | 0.0 /100 | #303 | Tragic 97.0% |
| Nicaraguans | 0.0 /100 | #304 | Tragic 97.0% |
| Ecuadorians | 0.0 /100 | #305 | Tragic 97.0% |
| Belizeans | 0.0 /100 | #306 | Tragic 96.9% |
| Immigrants | Somalia | 0.0 /100 | #307 | Tragic 96.9% |
| Hispanics or Latinos | 0.0 /100 | #308 | Tragic 96.9% |
| Immigrants | Haiti | 0.0 /100 | #309 | Tragic 96.9% |
| Immigrants | Azores | 0.0 /100 | #310 | Tragic 96.9% |
| Sri Lankans | 0.0 /100 | #311 | Tragic 96.9% |
| Cape Verdeans | 0.0 /100 | #312 | Tragic 96.9% |
| Guyanese | 0.0 /100 | #313 | Tragic 96.9% |
| Hondurans | 0.0 /100 | #314 | Tragic 96.9% |