Immigrants from Kuwait vs Nepalese Professional Degree
COMPARE
Immigrants from Kuwait
Nepalese
Professional Degree
Professional Degree Comparison
Immigrants from Kuwait
Nepalese
5.7%
PROFESSIONAL DEGREE
100.0/ 100
METRIC RATING
54th/ 347
METRIC RANK
3.2%
PROFESSIONAL DEGREE
0.1/ 100
METRIC RATING
317th/ 347
METRIC RANK
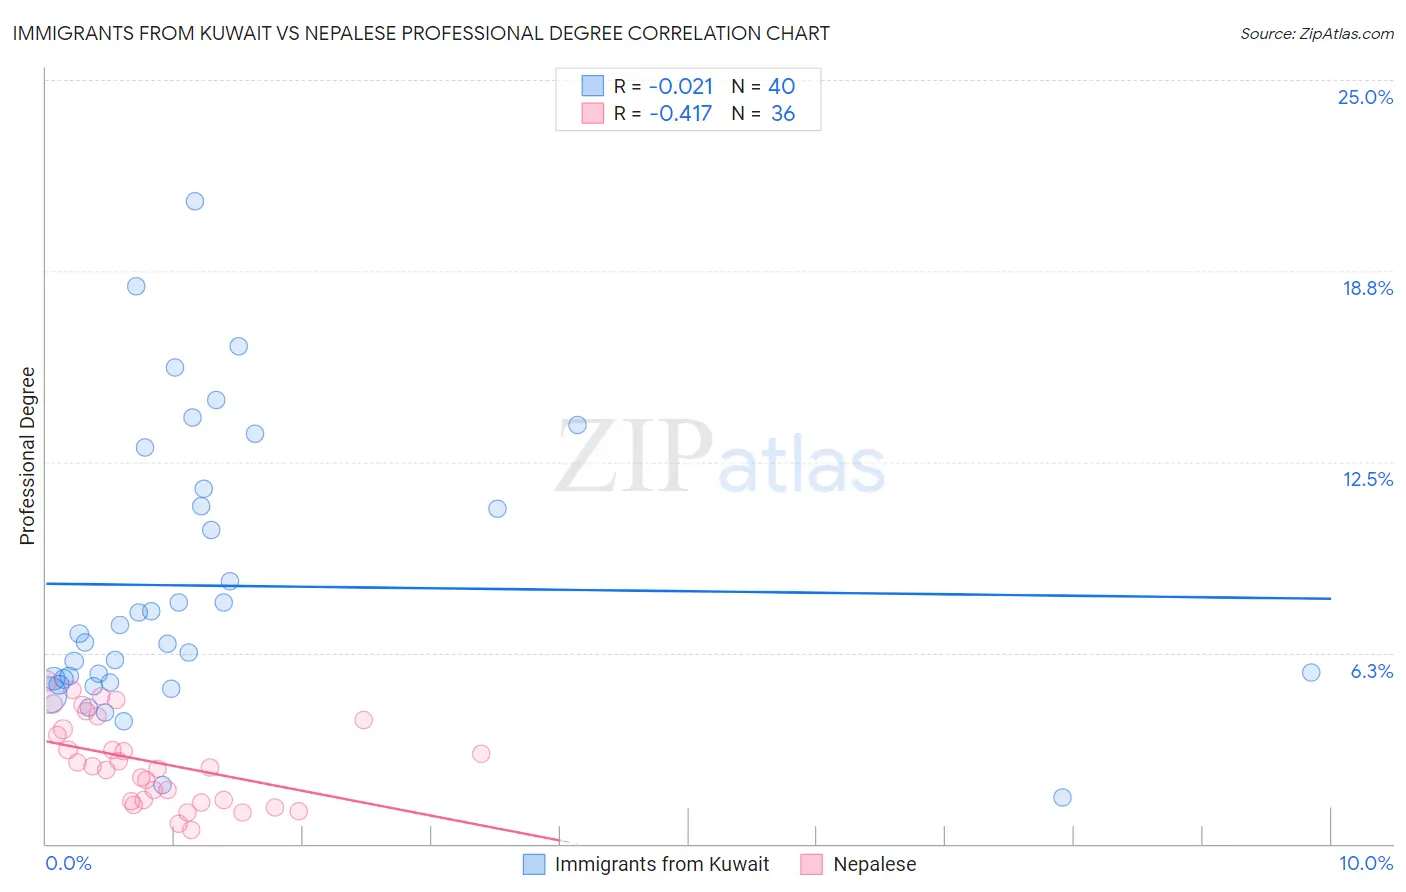
Immigrants from Kuwait vs Nepalese Professional Degree Correlation Chart
The statistical analysis conducted on geographies consisting of 136,863,125 people shows no correlation between the proportion of Immigrants from Kuwait and percentage of population with at least professional degree education in the United States with a correlation coefficient (R) of -0.021 and weighted average of 5.7%. Similarly, the statistical analysis conducted on geographies consisting of 24,504,313 people shows a moderate negative correlation between the proportion of Nepalese and percentage of population with at least professional degree education in the United States with a correlation coefficient (R) of -0.417 and weighted average of 3.2%, a difference of 77.4%.
Professional Degree Correlation Summary
| Measurement | Immigrants from Kuwait | Nepalese |
| Minimum | 1.5% | 0.47% |
| Maximum | 21.0% | 5.3% |
| Range | 19.5% | 4.9% |
| Mean | 8.4% | 2.7% |
| Median | 6.7% | 2.5% |
| Interquartile 25% (IQ1) | 5.3% | 1.4% |
| Interquartile 75% (IQ3) | 11.3% | 3.9% |
| Interquartile Range (IQR) | 6.0% | 2.5% |
| Standard Deviation (Sample) | 4.5% | 1.4% |
| Standard Deviation (Population) | 4.5% | 1.4% |
Similar Demographics by Professional Degree
Demographics Similar to Immigrants from Kuwait by Professional Degree
In terms of professional degree, the demographic groups most similar to Immigrants from Kuwait are Immigrants from Western Europe (5.7%, a difference of 0.40%), Immigrants from Malaysia (5.7%, a difference of 0.52%), South African (5.7%, a difference of 0.79%), Immigrants from Netherlands (5.8%, a difference of 1.0%), and Immigrants from Serbia (5.8%, a difference of 1.2%).
| Demographics | Rating | Rank | Professional Degree |
| Australians | 100.0 /100 | #47 | Exceptional 5.9% |
| Paraguayans | 100.0 /100 | #48 | Exceptional 5.9% |
| Immigrants | Latvia | 100.0 /100 | #49 | Exceptional 5.8% |
| Immigrants | Czechoslovakia | 100.0 /100 | #50 | Exceptional 5.8% |
| Immigrants | Greece | 100.0 /100 | #51 | Exceptional 5.8% |
| Immigrants | Serbia | 100.0 /100 | #52 | Exceptional 5.8% |
| Immigrants | Netherlands | 100.0 /100 | #53 | Exceptional 5.8% |
| Immigrants | Kuwait | 100.0 /100 | #54 | Exceptional 5.7% |
| Immigrants | Western Europe | 100.0 /100 | #55 | Exceptional 5.7% |
| Immigrants | Malaysia | 100.0 /100 | #56 | Exceptional 5.7% |
| South Africans | 100.0 /100 | #57 | Exceptional 5.7% |
| Bulgarians | 100.0 /100 | #58 | Exceptional 5.7% |
| Immigrants | Europe | 100.0 /100 | #59 | Exceptional 5.6% |
| Bolivians | 99.9 /100 | #60 | Exceptional 5.6% |
| Immigrants | Lithuania | 99.9 /100 | #61 | Exceptional 5.6% |
Demographics Similar to Nepalese by Professional Degree
In terms of professional degree, the demographic groups most similar to Nepalese are Immigrants from Micronesia (3.2%, a difference of 0.030%), Puerto Rican (3.2%, a difference of 0.21%), Immigrants from Laos (3.2%, a difference of 0.22%), Choctaw (3.2%, a difference of 0.27%), and Mexican American Indian (3.3%, a difference of 0.90%).
| Demographics | Rating | Rank | Professional Degree |
| Immigrants | Latin America | 0.1 /100 | #310 | Tragic 3.3% |
| Cherokee | 0.1 /100 | #311 | Tragic 3.3% |
| Sioux | 0.1 /100 | #312 | Tragic 3.3% |
| Yuman | 0.1 /100 | #313 | Tragic 3.3% |
| Mexican American Indians | 0.1 /100 | #314 | Tragic 3.3% |
| Immigrants | Laos | 0.1 /100 | #315 | Tragic 3.2% |
| Puerto Ricans | 0.1 /100 | #316 | Tragic 3.2% |
| Nepalese | 0.1 /100 | #317 | Tragic 3.2% |
| Immigrants | Micronesia | 0.1 /100 | #318 | Tragic 3.2% |
| Choctaw | 0.1 /100 | #319 | Tragic 3.2% |
| Seminole | 0.1 /100 | #320 | Tragic 3.2% |
| Tsimshian | 0.0 /100 | #321 | Tragic 3.2% |
| Hispanics or Latinos | 0.0 /100 | #322 | Tragic 3.2% |
| Inupiat | 0.0 /100 | #323 | Tragic 3.2% |
| Crow | 0.0 /100 | #324 | Tragic 3.2% |