American vs Immigrants from Saudi Arabia Associate's Degree
COMPARE
American
Immigrants from Saudi Arabia
Associate's Degree
Associate's Degree Comparison
Americans
Immigrants from Saudi Arabia
40.8%
ASSOCIATE'S DEGREE
0.2/ 100
METRIC RATING
269th/ 347
METRIC RANK
52.6%
ASSOCIATE'S DEGREE
99.9/ 100
METRIC RATING
41st/ 347
METRIC RANK
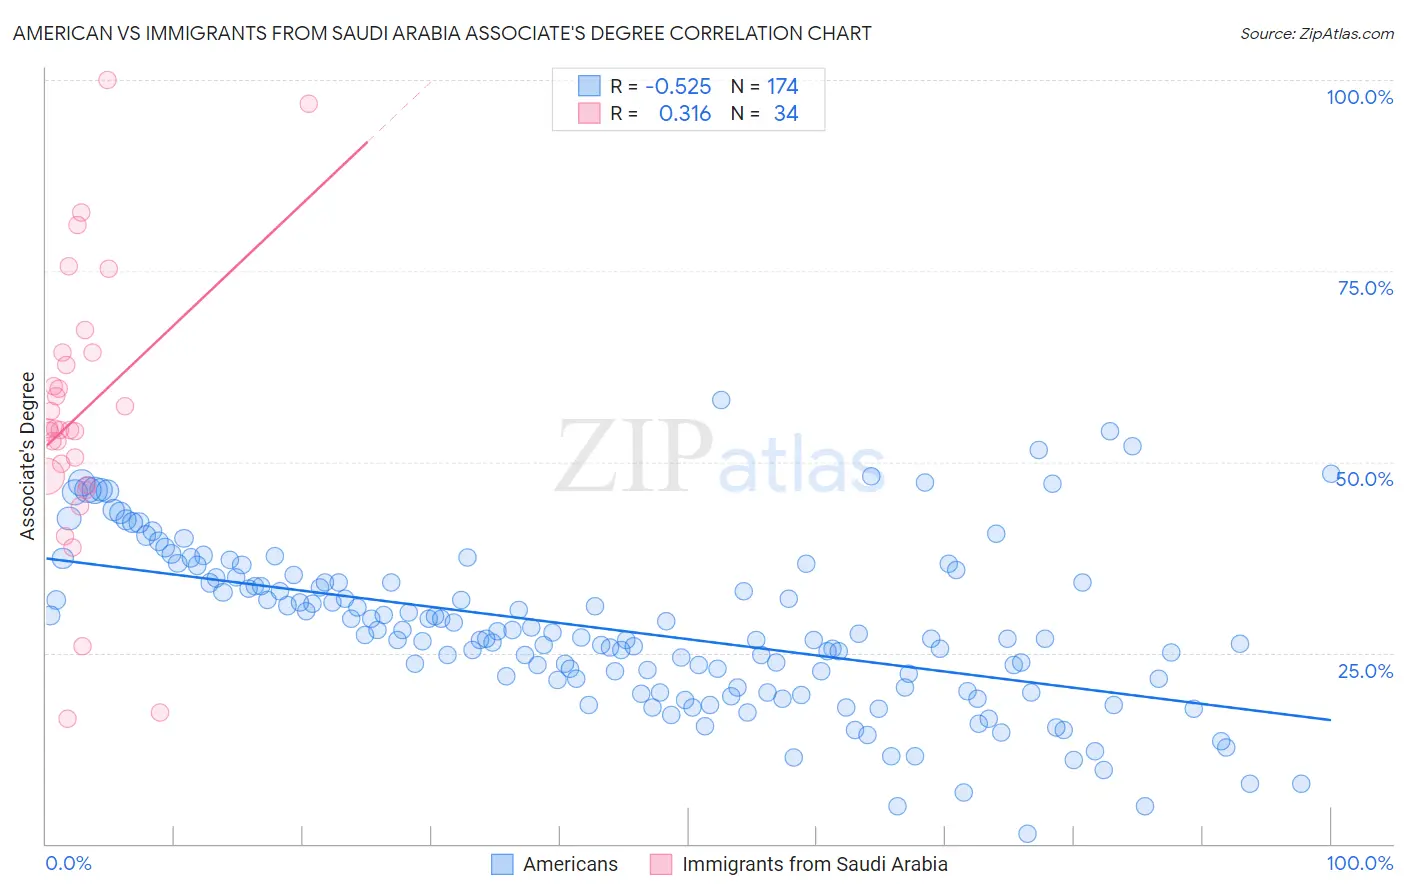
American vs Immigrants from Saudi Arabia Associate's Degree Correlation Chart
The statistical analysis conducted on geographies consisting of 581,858,249 people shows a substantial negative correlation between the proportion of Americans and percentage of population with at least associate's degree education in the United States with a correlation coefficient (R) of -0.525 and weighted average of 40.8%. Similarly, the statistical analysis conducted on geographies consisting of 164,289,450 people shows a mild positive correlation between the proportion of Immigrants from Saudi Arabia and percentage of population with at least associate's degree education in the United States with a correlation coefficient (R) of 0.316 and weighted average of 52.6%, a difference of 28.9%.
Associate's Degree Correlation Summary
| Measurement | American | Immigrants from Saudi Arabia |
| Minimum | 1.4% | 16.3% |
| Maximum | 58.1% | 100.0% |
| Range | 56.7% | 83.7% |
| Mean | 28.0% | 56.4% |
| Median | 26.9% | 54.3% |
| Interquartile 25% (IQ1) | 20.4% | 48.1% |
| Interquartile 75% (IQ3) | 34.2% | 64.3% |
| Interquartile Range (IQR) | 13.8% | 16.2% |
| Standard Deviation (Sample) | 10.6% | 18.3% |
| Standard Deviation (Population) | 10.5% | 18.1% |
Similar Demographics by Associate's Degree
Demographics Similar to Americans by Associate's Degree
In terms of associate's degree, the demographic groups most similar to Americans are Chippewa (40.7%, a difference of 0.050%), Central American Indian (40.8%, a difference of 0.18%), Immigrants from Laos (40.7%, a difference of 0.23%), Belizean (40.6%, a difference of 0.30%), and Hawaiian (40.9%, a difference of 0.38%).
| Demographics | Rating | Rank | Associate's Degree |
| Bahamians | 0.4 /100 | #262 | Tragic 41.5% |
| Immigrants | Jamaica | 0.3 /100 | #263 | Tragic 41.5% |
| Osage | 0.3 /100 | #264 | Tragic 41.5% |
| Africans | 0.2 /100 | #265 | Tragic 41.1% |
| Samoans | 0.2 /100 | #266 | Tragic 41.1% |
| Hawaiians | 0.2 /100 | #267 | Tragic 40.9% |
| Central American Indians | 0.2 /100 | #268 | Tragic 40.8% |
| Americans | 0.2 /100 | #269 | Tragic 40.8% |
| Chippewa | 0.2 /100 | #270 | Tragic 40.7% |
| Immigrants | Laos | 0.1 /100 | #271 | Tragic 40.7% |
| Belizeans | 0.1 /100 | #272 | Tragic 40.6% |
| Puget Sound Salish | 0.1 /100 | #273 | Tragic 40.5% |
| Immigrants | Dominica | 0.1 /100 | #274 | Tragic 40.5% |
| Potawatomi | 0.1 /100 | #275 | Tragic 40.4% |
| Puerto Ricans | 0.1 /100 | #276 | Tragic 40.4% |
Demographics Similar to Immigrants from Saudi Arabia by Associate's Degree
In terms of associate's degree, the demographic groups most similar to Immigrants from Saudi Arabia are Immigrants from Malaysia (52.5%, a difference of 0.030%), Immigrants from South Africa (52.5%, a difference of 0.040%), Estonian (52.5%, a difference of 0.13%), Immigrants from Lithuania (52.4%, a difference of 0.20%), and Immigrants from Bulgaria (52.4%, a difference of 0.34%).
| Demographics | Rating | Rank | Associate's Degree |
| Bulgarians | 100.0 /100 | #34 | Exceptional 53.3% |
| Russians | 100.0 /100 | #35 | Exceptional 53.2% |
| Immigrants | Russia | 100.0 /100 | #36 | Exceptional 53.1% |
| Immigrants | Denmark | 100.0 /100 | #37 | Exceptional 53.1% |
| Mongolians | 100.0 /100 | #38 | Exceptional 53.0% |
| Immigrants | Belarus | 99.9 /100 | #39 | Exceptional 52.8% |
| Immigrants | Latvia | 99.9 /100 | #40 | Exceptional 52.8% |
| Immigrants | Saudi Arabia | 99.9 /100 | #41 | Exceptional 52.6% |
| Immigrants | Malaysia | 99.9 /100 | #42 | Exceptional 52.5% |
| Immigrants | South Africa | 99.9 /100 | #43 | Exceptional 52.5% |
| Estonians | 99.9 /100 | #44 | Exceptional 52.5% |
| Immigrants | Lithuania | 99.9 /100 | #45 | Exceptional 52.4% |
| Immigrants | Bulgaria | 99.9 /100 | #46 | Exceptional 52.4% |
| Immigrants | Kuwait | 99.9 /100 | #47 | Exceptional 52.4% |
| Immigrants | Norway | 99.9 /100 | #48 | Exceptional 52.2% |