Immigrants from North America vs Immigrants from France Associate's Degree
COMPARE
Immigrants from North America
Immigrants from France
Associate's Degree
Associate's Degree Comparison
Immigrants from North America
Immigrants from France
50.1%
ASSOCIATE'S DEGREE
98.7/ 100
METRIC RATING
92nd/ 347
METRIC RANK
53.9%
ASSOCIATE'S DEGREE
100.0/ 100
METRIC RATING
29th/ 347
METRIC RANK
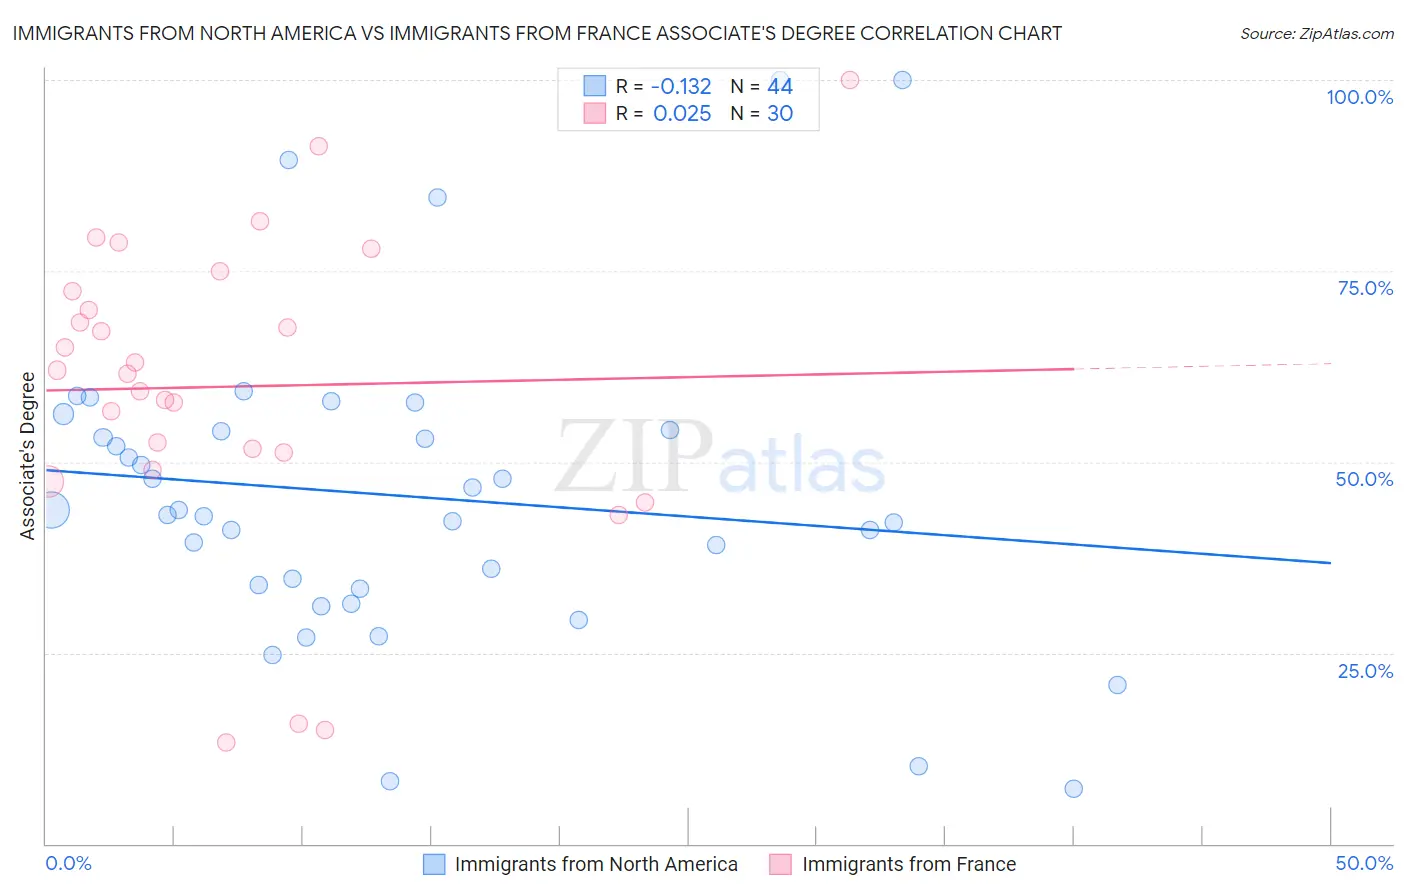
Immigrants from North America vs Immigrants from France Associate's Degree Correlation Chart
The statistical analysis conducted on geographies consisting of 462,434,172 people shows a poor negative correlation between the proportion of Immigrants from North America and percentage of population with at least associate's degree education in the United States with a correlation coefficient (R) of -0.132 and weighted average of 50.1%. Similarly, the statistical analysis conducted on geographies consisting of 287,913,763 people shows no correlation between the proportion of Immigrants from France and percentage of population with at least associate's degree education in the United States with a correlation coefficient (R) of 0.025 and weighted average of 53.9%, a difference of 7.6%.
Associate's Degree Correlation Summary
| Measurement | Immigrants from North America | Immigrants from France |
| Minimum | 7.1% | 13.2% |
| Maximum | 100.0% | 100.0% |
| Range | 92.9% | 86.8% |
| Mean | 45.6% | 59.9% |
| Median | 43.4% | 61.7% |
| Interquartile 25% (IQ1) | 33.6% | 51.3% |
| Interquartile 75% (IQ3) | 54.1% | 72.3% |
| Interquartile Range (IQR) | 20.5% | 21.0% |
| Standard Deviation (Sample) | 20.4% | 20.3% |
| Standard Deviation (Population) | 20.1% | 20.0% |
Similar Demographics by Associate's Degree
Demographics Similar to Immigrants from North America by Associate's Degree
In terms of associate's degree, the demographic groups most similar to Immigrants from North America are Immigrants from Western Asia (50.1%, a difference of 0.020%), Immigrants from Ethiopia (50.1%, a difference of 0.10%), Immigrants from Canada (50.1%, a difference of 0.11%), Immigrants from Western Europe (50.1%, a difference of 0.11%), and Immigrants from Brazil (50.0%, a difference of 0.15%).
| Demographics | Rating | Rank | Associate's Degree |
| Immigrants | Egypt | 98.9 /100 | #85 | Exceptional 50.2% |
| Immigrants | Croatia | 98.9 /100 | #86 | Exceptional 50.2% |
| Immigrants | Moldova | 98.8 /100 | #87 | Exceptional 50.2% |
| Immigrants | Canada | 98.7 /100 | #88 | Exceptional 50.1% |
| Immigrants | Western Europe | 98.7 /100 | #89 | Exceptional 50.1% |
| Immigrants | Ethiopia | 98.7 /100 | #90 | Exceptional 50.1% |
| Immigrants | Western Asia | 98.7 /100 | #91 | Exceptional 50.1% |
| Immigrants | North America | 98.7 /100 | #92 | Exceptional 50.1% |
| Immigrants | Brazil | 98.5 /100 | #93 | Exceptional 50.0% |
| Laotians | 98.4 /100 | #94 | Exceptional 49.9% |
| Immigrants | England | 98.0 /100 | #95 | Exceptional 49.7% |
| Romanians | 98.0 /100 | #96 | Exceptional 49.7% |
| Immigrants | Ukraine | 98.0 /100 | #97 | Exceptional 49.7% |
| Immigrants | Northern Africa | 97.9 /100 | #98 | Exceptional 49.7% |
| Macedonians | 97.8 /100 | #99 | Exceptional 49.6% |
Demographics Similar to Immigrants from France by Associate's Degree
In terms of associate's degree, the demographic groups most similar to Immigrants from France are Turkish (53.9%, a difference of 0.010%), Latvian (53.9%, a difference of 0.090%), Immigrants from Sri Lanka (53.7%, a difference of 0.42%), Immigrants from Northern Europe (53.5%, a difference of 0.78%), and Immigrants from Turkey (53.4%, a difference of 0.81%).
| Demographics | Rating | Rank | Associate's Degree |
| Immigrants | Japan | 100.0 /100 | #22 | Exceptional 54.6% |
| Burmese | 100.0 /100 | #23 | Exceptional 54.6% |
| Immigrants | Korea | 100.0 /100 | #24 | Exceptional 54.5% |
| Immigrants | Switzerland | 100.0 /100 | #25 | Exceptional 54.5% |
| Immigrants | Belgium | 100.0 /100 | #26 | Exceptional 54.5% |
| Latvians | 100.0 /100 | #27 | Exceptional 53.9% |
| Turks | 100.0 /100 | #28 | Exceptional 53.9% |
| Immigrants | France | 100.0 /100 | #29 | Exceptional 53.9% |
| Immigrants | Sri Lanka | 100.0 /100 | #30 | Exceptional 53.7% |
| Immigrants | Northern Europe | 100.0 /100 | #31 | Exceptional 53.5% |
| Immigrants | Turkey | 100.0 /100 | #32 | Exceptional 53.4% |
| Israelis | 100.0 /100 | #33 | Exceptional 53.4% |
| Bulgarians | 100.0 /100 | #34 | Exceptional 53.3% |
| Russians | 100.0 /100 | #35 | Exceptional 53.2% |
| Immigrants | Russia | 100.0 /100 | #36 | Exceptional 53.1% |