Apache vs Tohono O'odham 12th Grade, No Diploma
COMPARE
Apache
Tohono O'odham
12th Grade, No Diploma
12th Grade, No Diploma Comparison
Apache
Tohono O'odham
87.3%
12TH GRADE, NO DIPLOMA
0.0/ 100
METRIC RATING
316th/ 347
METRIC RANK
84.7%
12TH GRADE, NO DIPLOMA
0.0/ 100
METRIC RATING
336th/ 347
METRIC RANK
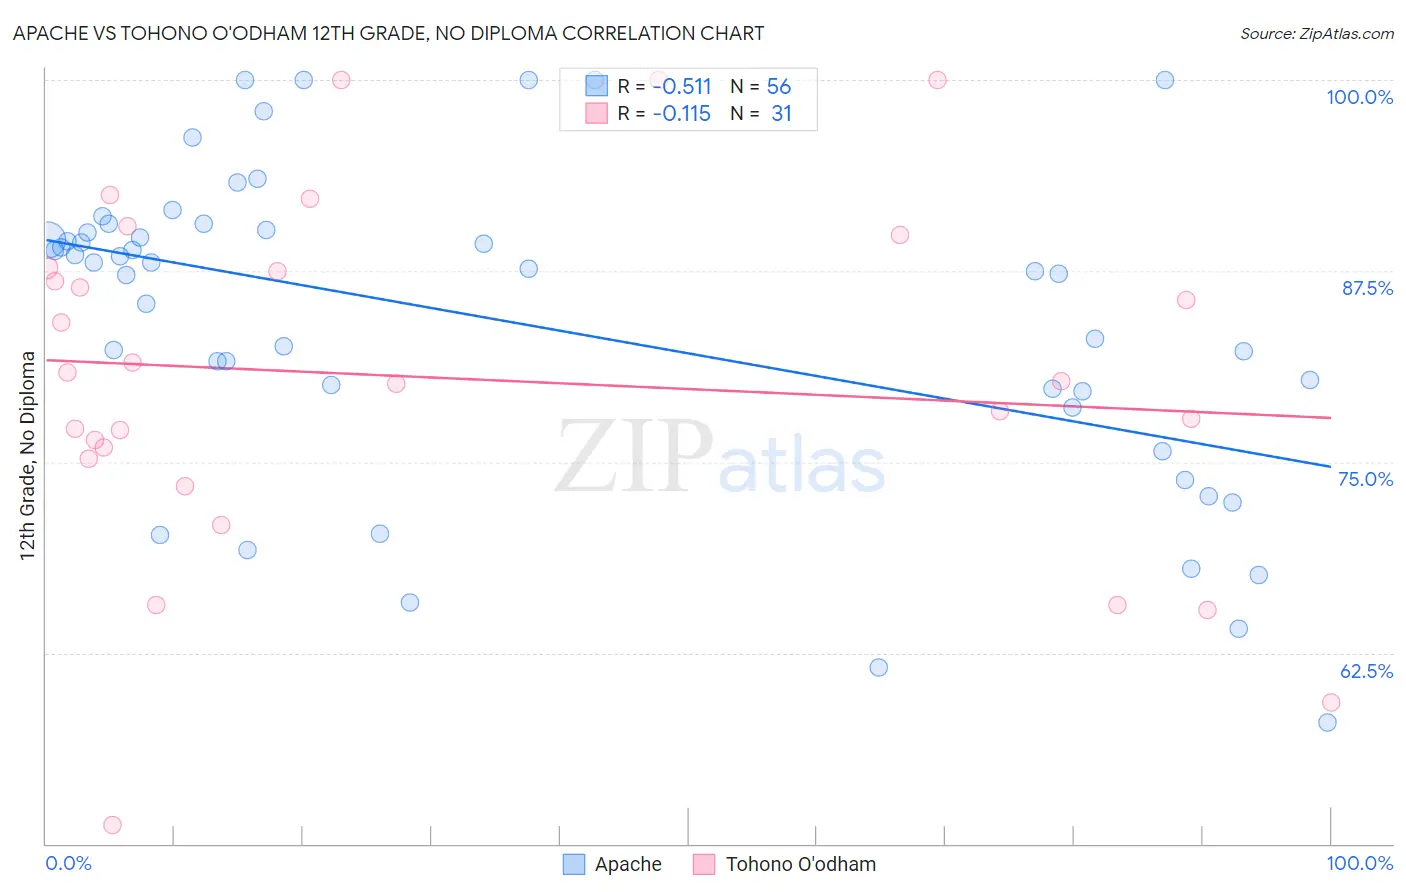
Apache vs Tohono O'odham 12th Grade, No Diploma Correlation Chart
The statistical analysis conducted on geographies consisting of 231,143,094 people shows a substantial negative correlation between the proportion of Apache and percentage of population with at least 12th grade (no diploma) education in the United States with a correlation coefficient (R) of -0.511 and weighted average of 87.3%. Similarly, the statistical analysis conducted on geographies consisting of 58,730,615 people shows a poor negative correlation between the proportion of Tohono O'odham and percentage of population with at least 12th grade (no diploma) education in the United States with a correlation coefficient (R) of -0.115 and weighted average of 84.7%, a difference of 3.1%.
12th Grade, No Diploma Correlation Summary
| Measurement | Apache | Tohono O'odham |
| Minimum | 58.0% | 51.2% |
| Maximum | 100.0% | 100.0% |
| Range | 42.0% | 48.8% |
| Mean | 84.1% | 80.5% |
| Median | 87.6% | 80.3% |
| Interquartile 25% (IQ1) | 79.1% | 75.2% |
| Interquartile 75% (IQ3) | 90.1% | 87.7% |
| Interquartile Range (IQR) | 11.0% | 12.5% |
| Standard Deviation (Sample) | 10.4% | 11.6% |
| Standard Deviation (Population) | 10.4% | 11.4% |
Demographics Similar to Apache and Tohono O'odham by 12th Grade, No Diploma
In terms of 12th grade, no diploma, the demographic groups most similar to Apache are Navajo (87.1%, a difference of 0.28%), Belizean (87.0%, a difference of 0.35%), Immigrants from Belize (87.0%, a difference of 0.43%), Immigrants from Nicaragua (86.6%, a difference of 0.89%), and Puerto Rican (86.5%, a difference of 0.92%). Similarly, the demographic groups most similar to Tohono O'odham are Immigrants from Yemen (84.8%, a difference of 0.14%), Immigrants from Dominican Republic (84.9%, a difference of 0.18%), Immigrants from Latin America (85.0%, a difference of 0.32%), Immigrants from Honduras (85.0%, a difference of 0.39%), and Central American (85.2%, a difference of 0.60%).
| Demographics | Rating | Rank | 12th Grade, No Diploma |
| Apache | 0.0 /100 | #316 | Tragic 87.3% |
| Navajo | 0.0 /100 | #317 | Tragic 87.1% |
| Belizeans | 0.0 /100 | #318 | Tragic 87.0% |
| Immigrants | Belize | 0.0 /100 | #319 | Tragic 87.0% |
| Immigrants | Nicaragua | 0.0 /100 | #320 | Tragic 86.6% |
| Puerto Ricans | 0.0 /100 | #321 | Tragic 86.5% |
| Central American Indians | 0.0 /100 | #322 | Tragic 86.5% |
| Yuman | 0.0 /100 | #323 | Tragic 86.5% |
| Immigrants | Cabo Verde | 0.0 /100 | #324 | Tragic 85.8% |
| Mexican American Indians | 0.0 /100 | #325 | Tragic 85.7% |
| Dominicans | 0.0 /100 | #326 | Tragic 85.7% |
| Lumbee | 0.0 /100 | #327 | Tragic 85.7% |
| Hondurans | 0.0 /100 | #328 | Tragic 85.5% |
| Hispanics or Latinos | 0.0 /100 | #329 | Tragic 85.4% |
| Immigrants | Azores | 0.0 /100 | #330 | Tragic 85.3% |
| Central Americans | 0.0 /100 | #331 | Tragic 85.2% |
| Immigrants | Honduras | 0.0 /100 | #332 | Tragic 85.0% |
| Immigrants | Latin America | 0.0 /100 | #333 | Tragic 85.0% |
| Immigrants | Dominican Republic | 0.0 /100 | #334 | Tragic 84.9% |
| Immigrants | Yemen | 0.0 /100 | #335 | Tragic 84.8% |
| Tohono O'odham | 0.0 /100 | #336 | Tragic 84.7% |