Apache vs Immigrants from Honduras 4th Grade
COMPARE
Apache
Immigrants from Honduras
4th Grade
4th Grade Comparison
Apache
Immigrants from Honduras
97.6%
4TH GRADE
61.3/ 100
METRIC RATING
160th/ 347
METRIC RANK
95.8%
4TH GRADE
0.0/ 100
METRIC RATING
332nd/ 347
METRIC RANK
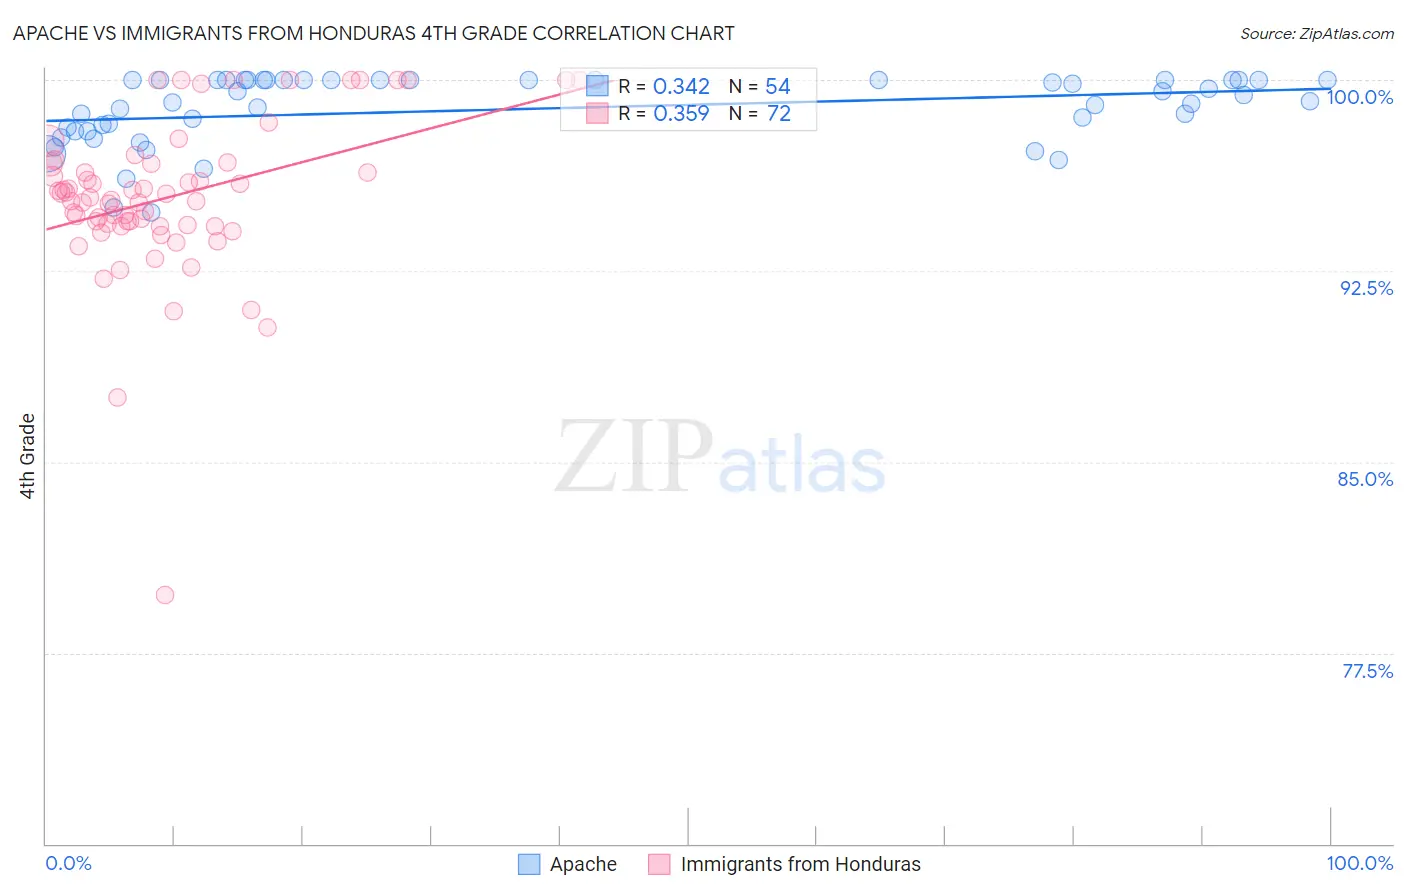
Apache vs Immigrants from Honduras 4th Grade Correlation Chart
The statistical analysis conducted on geographies consisting of 231,142,814 people shows a mild positive correlation between the proportion of Apache and percentage of population with at least 4th grade education in the United States with a correlation coefficient (R) of 0.342 and weighted average of 97.6%. Similarly, the statistical analysis conducted on geographies consisting of 322,637,445 people shows a mild positive correlation between the proportion of Immigrants from Honduras and percentage of population with at least 4th grade education in the United States with a correlation coefficient (R) of 0.359 and weighted average of 95.8%, a difference of 1.9%.
4th Grade Correlation Summary
| Measurement | Apache | Immigrants from Honduras |
| Minimum | 94.8% | 79.8% |
| Maximum | 100.0% | 100.0% |
| Range | 5.2% | 20.2% |
| Mean | 98.9% | 95.4% |
| Median | 99.3% | 95.3% |
| Interquartile 25% (IQ1) | 98.0% | 94.3% |
| Interquartile 75% (IQ3) | 100.0% | 96.7% |
| Interquartile Range (IQR) | 2.0% | 2.4% |
| Standard Deviation (Sample) | 1.4% | 3.1% |
| Standard Deviation (Population) | 1.3% | 3.1% |
Similar Demographics by 4th Grade
Demographics Similar to Apache by 4th Grade
In terms of 4th grade, the demographic groups most similar to Apache are Marshallese (97.6%, a difference of 0.0%), Bermudan (97.6%, a difference of 0.0%), Immigrants from Iran (97.6%, a difference of 0.0%), Immigrants from Italy (97.6%, a difference of 0.010%), and Ugandan (97.6%, a difference of 0.010%).
| Demographics | Rating | Rank | 4th Grade |
| Immigrants | Eastern Europe | 71.3 /100 | #153 | Good 97.6% |
| Immigrants | Russia | 67.0 /100 | #154 | Good 97.6% |
| Albanians | 67.0 /100 | #155 | Good 97.6% |
| Immigrants | Jordan | 66.9 /100 | #156 | Good 97.6% |
| Immigrants | Bosnia and Herzegovina | 66.0 /100 | #157 | Good 97.6% |
| French American Indians | 65.9 /100 | #158 | Good 97.6% |
| Immigrants | Italy | 63.7 /100 | #159 | Good 97.6% |
| Apache | 61.3 /100 | #160 | Good 97.6% |
| Marshallese | 60.8 /100 | #161 | Good 97.6% |
| Bermudans | 60.5 /100 | #162 | Good 97.6% |
| Immigrants | Iran | 60.3 /100 | #163 | Good 97.6% |
| Ugandans | 58.9 /100 | #164 | Average 97.6% |
| Venezuelans | 58.7 /100 | #165 | Average 97.6% |
| Kenyans | 56.5 /100 | #166 | Average 97.5% |
| Immigrants | Poland | 55.9 /100 | #167 | Average 97.5% |
Demographics Similar to Immigrants from Honduras by 4th Grade
In terms of 4th grade, the demographic groups most similar to Immigrants from Honduras are Immigrants from Armenia (95.8%, a difference of 0.010%), Immigrants from Dominican Republic (95.7%, a difference of 0.050%), Immigrants from Cabo Verde (95.7%, a difference of 0.050%), Immigrants from Cambodia (95.8%, a difference of 0.060%), and Immigrants from Fiji (95.8%, a difference of 0.060%).
| Demographics | Rating | Rank | 4th Grade |
| Dominicans | 0.0 /100 | #325 | Tragic 96.0% |
| Hispanics or Latinos | 0.0 /100 | #326 | Tragic 96.0% |
| Hondurans | 0.0 /100 | #327 | Tragic 96.0% |
| Mexican American Indians | 0.0 /100 | #328 | Tragic 95.8% |
| Immigrants | Cambodia | 0.0 /100 | #329 | Tragic 95.8% |
| Immigrants | Fiji | 0.0 /100 | #330 | Tragic 95.8% |
| Immigrants | Armenia | 0.0 /100 | #331 | Tragic 95.8% |
| Immigrants | Honduras | 0.0 /100 | #332 | Tragic 95.8% |
| Immigrants | Dominican Republic | 0.0 /100 | #333 | Tragic 95.7% |
| Immigrants | Cabo Verde | 0.0 /100 | #334 | Tragic 95.7% |
| Immigrants | Latin America | 0.0 /100 | #335 | Tragic 95.7% |
| Mexicans | 0.0 /100 | #336 | Tragic 95.6% |
| Central Americans | 0.0 /100 | #337 | Tragic 95.5% |
| Nepalese | 0.0 /100 | #338 | Tragic 95.5% |
| Guatemalans | 0.0 /100 | #339 | Tragic 95.3% |