Houma vs Welsh 2nd Grade
COMPARE
Houma
Welsh
2nd Grade
2nd Grade Comparison
Houma
Welsh
97.2%
2ND GRADE
0.0/ 100
METRIC RATING
289th/ 347
METRIC RANK
98.5%
2ND GRADE
100.0/ 100
METRIC RATING
26th/ 347
METRIC RANK
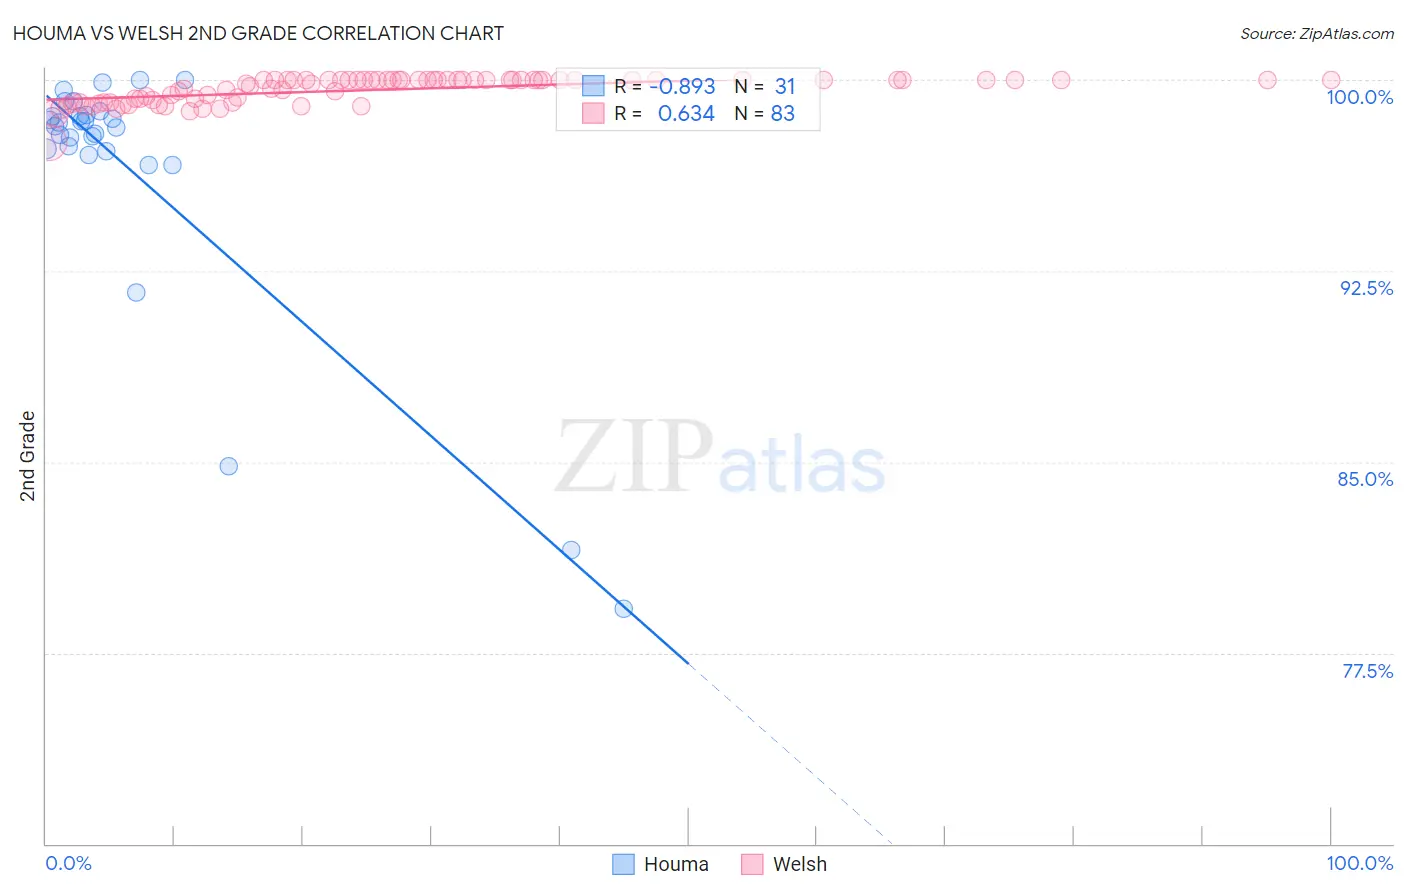
Houma vs Welsh 2nd Grade Correlation Chart
The statistical analysis conducted on geographies consisting of 36,795,916 people shows a very strong negative correlation between the proportion of Houma and percentage of population with at least 2nd grade education in the United States with a correlation coefficient (R) of -0.893 and weighted average of 97.2%. Similarly, the statistical analysis conducted on geographies consisting of 528,593,932 people shows a significant positive correlation between the proportion of Welsh and percentage of population with at least 2nd grade education in the United States with a correlation coefficient (R) of 0.634 and weighted average of 98.5%, a difference of 1.4%.
2nd Grade Correlation Summary
| Measurement | Houma | Welsh |
| Minimum | 79.2% | 97.5% |
| Maximum | 100.0% | 100.0% |
| Range | 20.8% | 2.5% |
| Mean | 96.5% | 99.6% |
| Median | 98.2% | 100.0% |
| Interquartile 25% (IQ1) | 97.2% | 99.1% |
| Interquartile 75% (IQ3) | 98.6% | 100.0% |
| Interquartile Range (IQR) | 1.4% | 0.88% |
| Standard Deviation (Sample) | 5.1% | 0.50% |
| Standard Deviation (Population) | 5.1% | 0.50% |
Similar Demographics by 2nd Grade
Demographics Similar to Houma by 2nd Grade
In terms of 2nd grade, the demographic groups most similar to Houma are Immigrants from St. Vincent and the Grenadines (97.2%, a difference of 0.0%), Immigrants from Afghanistan (97.2%, a difference of 0.010%), Immigrants from Barbados (97.2%, a difference of 0.020%), Immigrants from Portugal (97.2%, a difference of 0.020%), and Immigrants from Thailand (97.2%, a difference of 0.020%).
| Demographics | Rating | Rank | 2nd Grade |
| Barbadians | 0.1 /100 | #282 | Tragic 97.3% |
| Immigrants | Trinidad and Tobago | 0.0 /100 | #283 | Tragic 97.2% |
| Immigrants | West Indies | 0.0 /100 | #284 | Tragic 97.2% |
| Immigrants | Hong Kong | 0.0 /100 | #285 | Tragic 97.2% |
| Immigrants | Barbados | 0.0 /100 | #286 | Tragic 97.2% |
| Immigrants | Portugal | 0.0 /100 | #287 | Tragic 97.2% |
| Immigrants | Thailand | 0.0 /100 | #288 | Tragic 97.2% |
| Houma | 0.0 /100 | #289 | Tragic 97.2% |
| Immigrants | St. Vincent and the Grenadines | 0.0 /100 | #290 | Tragic 97.2% |
| Immigrants | Afghanistan | 0.0 /100 | #291 | Tragic 97.2% |
| Immigrants | Eritrea | 0.0 /100 | #292 | Tragic 97.2% |
| British West Indians | 0.0 /100 | #293 | Tragic 97.2% |
| Malaysians | 0.0 /100 | #294 | Tragic 97.1% |
| Immigrants | Grenada | 0.0 /100 | #295 | Tragic 97.1% |
| Immigrants | Immigrants | 0.0 /100 | #296 | Tragic 97.1% |
Demographics Similar to Welsh by 2nd Grade
In terms of 2nd grade, the demographic groups most similar to Welsh are Scotch-Irish (98.5%, a difference of 0.010%), Croatian (98.5%, a difference of 0.010%), Arapaho (98.5%, a difference of 0.010%), French (98.5%, a difference of 0.010%), and Finnish (98.5%, a difference of 0.020%).
| Demographics | Rating | Rank | 2nd Grade |
| Finns | 100.0 /100 | #19 | Exceptional 98.5% |
| Sioux | 100.0 /100 | #20 | Exceptional 98.5% |
| Lithuanians | 100.0 /100 | #21 | Exceptional 98.5% |
| Poles | 100.0 /100 | #22 | Exceptional 98.5% |
| Danes | 100.0 /100 | #23 | Exceptional 98.5% |
| Pennsylvania Germans | 100.0 /100 | #24 | Exceptional 98.5% |
| Scotch-Irish | 100.0 /100 | #25 | Exceptional 98.5% |
| Welsh | 100.0 /100 | #26 | Exceptional 98.5% |
| Croatians | 100.0 /100 | #27 | Exceptional 98.5% |
| Arapaho | 100.0 /100 | #28 | Exceptional 98.5% |
| French | 100.0 /100 | #29 | Exceptional 98.5% |
| Europeans | 100.0 /100 | #30 | Exceptional 98.5% |
| Czechs | 100.0 /100 | #31 | Exceptional 98.5% |
| French Canadians | 100.0 /100 | #32 | Exceptional 98.5% |
| Scandinavians | 100.0 /100 | #33 | Exceptional 98.5% |