Immigrants from Cuba vs Welsh 2nd Grade
COMPARE
Immigrants from Cuba
Welsh
2nd Grade
2nd Grade Comparison
Immigrants from Cuba
Welsh
97.0%
2ND GRADE
0.0/ 100
METRIC RATING
297th/ 347
METRIC RANK
98.5%
2ND GRADE
100.0/ 100
METRIC RATING
26th/ 347
METRIC RANK
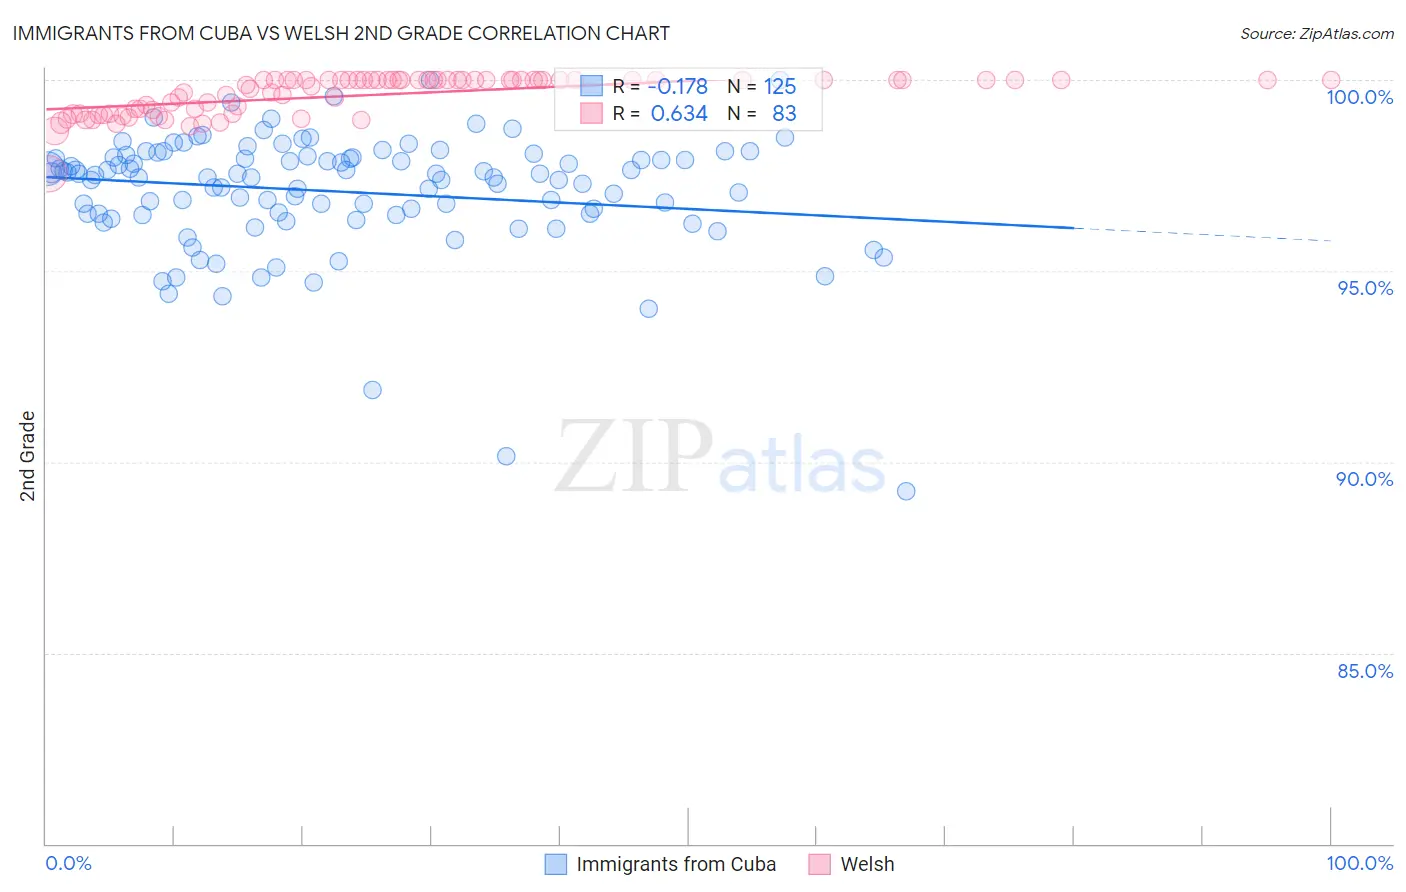
Immigrants from Cuba vs Welsh 2nd Grade Correlation Chart
The statistical analysis conducted on geographies consisting of 326,028,159 people shows a poor negative correlation between the proportion of Immigrants from Cuba and percentage of population with at least 2nd grade education in the United States with a correlation coefficient (R) of -0.178 and weighted average of 97.0%. Similarly, the statistical analysis conducted on geographies consisting of 528,593,932 people shows a significant positive correlation between the proportion of Welsh and percentage of population with at least 2nd grade education in the United States with a correlation coefficient (R) of 0.634 and weighted average of 98.5%, a difference of 1.6%.
2nd Grade Correlation Summary
| Measurement | Immigrants from Cuba | Welsh |
| Minimum | 89.2% | 97.5% |
| Maximum | 100.0% | 100.0% |
| Range | 10.8% | 2.5% |
| Mean | 97.1% | 99.6% |
| Median | 97.5% | 100.0% |
| Interquartile 25% (IQ1) | 96.5% | 99.1% |
| Interquartile 75% (IQ3) | 98.0% | 100.0% |
| Interquartile Range (IQR) | 1.5% | 0.88% |
| Standard Deviation (Sample) | 1.6% | 0.50% |
| Standard Deviation (Population) | 1.6% | 0.50% |
Similar Demographics by 2nd Grade
Demographics Similar to Immigrants from Cuba by 2nd Grade
In terms of 2nd grade, the demographic groups most similar to Immigrants from Cuba are Immigrants from Dominica (97.0%, a difference of 0.0%), Haitian (97.0%, a difference of 0.0%), Immigrants from South Eastern Asia (97.0%, a difference of 0.020%), Central American Indian (97.0%, a difference of 0.040%), and Immigrants (97.1%, a difference of 0.060%).
| Demographics | Rating | Rank | 2nd Grade |
| Immigrants | St. Vincent and the Grenadines | 0.0 /100 | #290 | Tragic 97.2% |
| Immigrants | Afghanistan | 0.0 /100 | #291 | Tragic 97.2% |
| Immigrants | Eritrea | 0.0 /100 | #292 | Tragic 97.2% |
| British West Indians | 0.0 /100 | #293 | Tragic 97.2% |
| Malaysians | 0.0 /100 | #294 | Tragic 97.1% |
| Immigrants | Grenada | 0.0 /100 | #295 | Tragic 97.1% |
| Immigrants | Immigrants | 0.0 /100 | #296 | Tragic 97.1% |
| Immigrants | Cuba | 0.0 /100 | #297 | Tragic 97.0% |
| Immigrants | Dominica | 0.0 /100 | #298 | Tragic 97.0% |
| Haitians | 0.0 /100 | #299 | Tragic 97.0% |
| Immigrants | South Eastern Asia | 0.0 /100 | #300 | Tragic 97.0% |
| Central American Indians | 0.0 /100 | #301 | Tragic 97.0% |
| Somalis | 0.0 /100 | #302 | Tragic 97.0% |
| Ecuadorians | 0.0 /100 | #303 | Tragic 96.9% |
| Immigrants | Caribbean | 0.0 /100 | #304 | Tragic 96.9% |
Demographics Similar to Welsh by 2nd Grade
In terms of 2nd grade, the demographic groups most similar to Welsh are Scotch-Irish (98.5%, a difference of 0.010%), Croatian (98.5%, a difference of 0.010%), Arapaho (98.5%, a difference of 0.010%), French (98.5%, a difference of 0.010%), and Finnish (98.5%, a difference of 0.020%).
| Demographics | Rating | Rank | 2nd Grade |
| Finns | 100.0 /100 | #19 | Exceptional 98.5% |
| Sioux | 100.0 /100 | #20 | Exceptional 98.5% |
| Lithuanians | 100.0 /100 | #21 | Exceptional 98.5% |
| Poles | 100.0 /100 | #22 | Exceptional 98.5% |
| Danes | 100.0 /100 | #23 | Exceptional 98.5% |
| Pennsylvania Germans | 100.0 /100 | #24 | Exceptional 98.5% |
| Scotch-Irish | 100.0 /100 | #25 | Exceptional 98.5% |
| Welsh | 100.0 /100 | #26 | Exceptional 98.5% |
| Croatians | 100.0 /100 | #27 | Exceptional 98.5% |
| Arapaho | 100.0 /100 | #28 | Exceptional 98.5% |
| French | 100.0 /100 | #29 | Exceptional 98.5% |
| Europeans | 100.0 /100 | #30 | Exceptional 98.5% |
| Czechs | 100.0 /100 | #31 | Exceptional 98.5% |
| French Canadians | 100.0 /100 | #32 | Exceptional 98.5% |
| Scandinavians | 100.0 /100 | #33 | Exceptional 98.5% |