American vs Immigrants from South Africa Professional Degree
COMPARE
American
Immigrants from South Africa
Professional Degree
Professional Degree Comparison
Americans
Immigrants from South Africa
3.6%
PROFESSIONAL DEGREE
0.5/ 100
METRIC RATING
273rd/ 347
METRIC RANK
6.0%
PROFESSIONAL DEGREE
100.0/ 100
METRIC RATING
39th/ 347
METRIC RANK
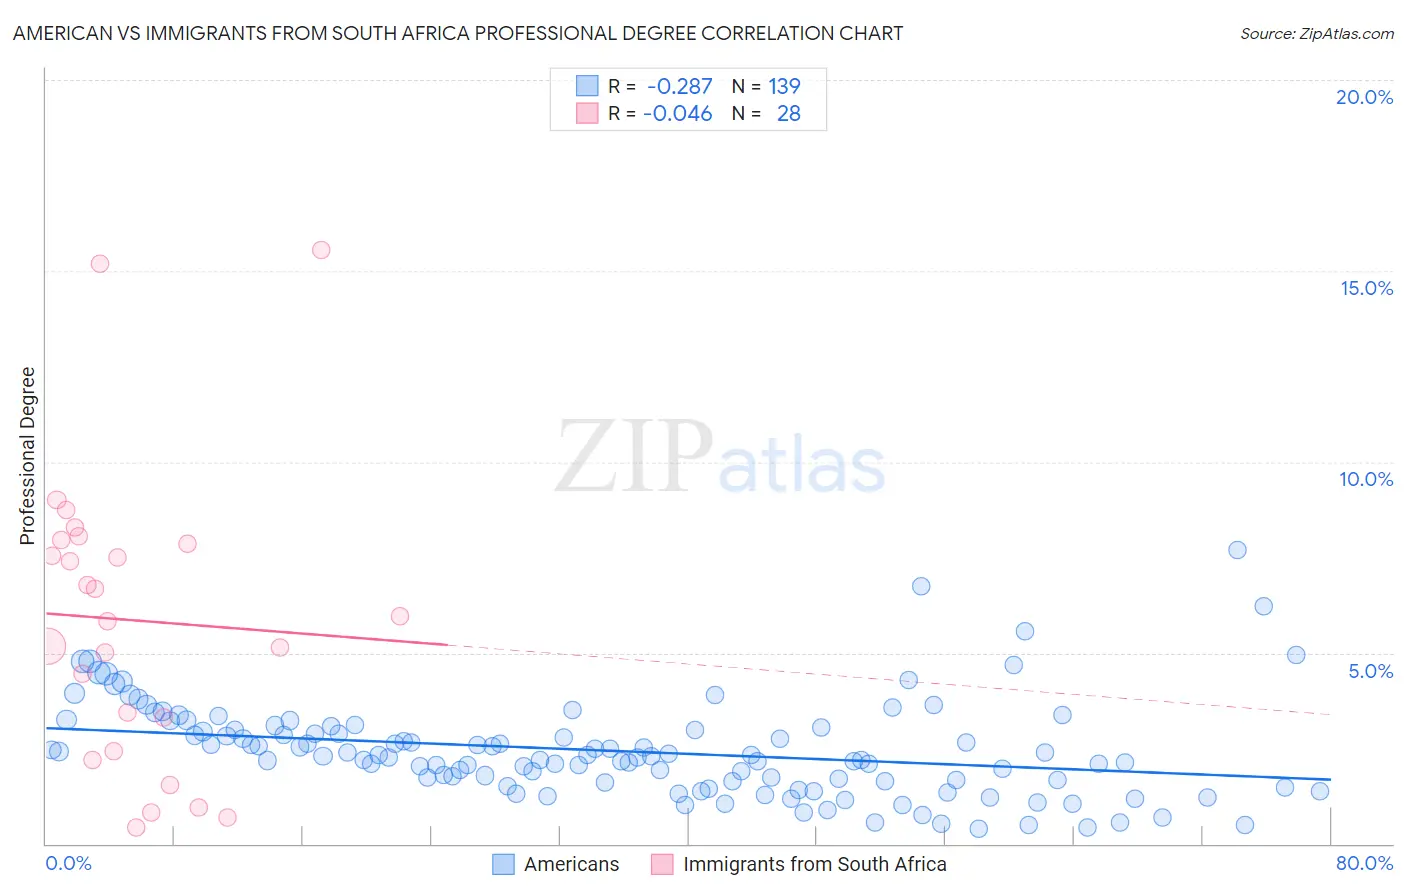
American vs Immigrants from South Africa Professional Degree Correlation Chart
The statistical analysis conducted on geographies consisting of 570,969,920 people shows a weak negative correlation between the proportion of Americans and percentage of population with at least professional degree education in the United States with a correlation coefficient (R) of -0.287 and weighted average of 3.6%. Similarly, the statistical analysis conducted on geographies consisting of 233,136,921 people shows no correlation between the proportion of Immigrants from South Africa and percentage of population with at least professional degree education in the United States with a correlation coefficient (R) of -0.046 and weighted average of 6.0%, a difference of 68.1%.
Professional Degree Correlation Summary
| Measurement | American | Immigrants from South Africa |
| Minimum | 0.39% | 0.42% |
| Maximum | 7.7% | 15.5% |
| Range | 7.3% | 15.1% |
| Mean | 2.4% | 5.8% |
| Median | 2.3% | 5.9% |
| Interquartile 25% (IQ1) | 1.6% | 2.9% |
| Interquartile 75% (IQ3) | 3.0% | 7.9% |
| Interquartile Range (IQR) | 1.4% | 5.0% |
| Standard Deviation (Sample) | 1.2% | 3.8% |
| Standard Deviation (Population) | 1.2% | 3.7% |
Similar Demographics by Professional Degree
Demographics Similar to Americans by Professional Degree
In terms of professional degree, the demographic groups most similar to Americans are Immigrants from Jamaica (3.6%, a difference of 0.060%), Belizean (3.6%, a difference of 0.090%), Potawatomi (3.6%, a difference of 0.13%), Immigrants from Dominica (3.6%, a difference of 0.35%), and Liberian (3.6%, a difference of 0.40%).
| Demographics | Rating | Rank | Professional Degree |
| Central American Indians | 0.8 /100 | #266 | Tragic 3.6% |
| Delaware | 0.7 /100 | #267 | Tragic 3.6% |
| Aleuts | 0.7 /100 | #268 | Tragic 3.6% |
| Immigrants | Cuba | 0.6 /100 | #269 | Tragic 3.6% |
| Central Americans | 0.6 /100 | #270 | Tragic 3.6% |
| Belizeans | 0.5 /100 | #271 | Tragic 3.6% |
| Immigrants | Jamaica | 0.5 /100 | #272 | Tragic 3.6% |
| Americans | 0.5 /100 | #273 | Tragic 3.6% |
| Potawatomi | 0.5 /100 | #274 | Tragic 3.6% |
| Immigrants | Dominica | 0.5 /100 | #275 | Tragic 3.6% |
| Liberians | 0.5 /100 | #276 | Tragic 3.6% |
| Cheyenne | 0.5 /100 | #277 | Tragic 3.6% |
| Japanese | 0.5 /100 | #278 | Tragic 3.5% |
| Immigrants | Portugal | 0.5 /100 | #279 | Tragic 3.5% |
| Dominicans | 0.5 /100 | #280 | Tragic 3.5% |
Demographics Similar to Immigrants from South Africa by Professional Degree
In terms of professional degree, the demographic groups most similar to Immigrants from South Africa are Immigrants from Norway (6.0%, a difference of 0.25%), Immigrants from Austria (6.0%, a difference of 0.45%), Cambodian (6.0%, a difference of 0.47%), New Zealander (6.0%, a difference of 0.66%), and Estonian (6.0%, a difference of 0.67%).
| Demographics | Rating | Rank | Professional Degree |
| Thais | 100.0 /100 | #32 | Exceptional 6.1% |
| Burmese | 100.0 /100 | #33 | Exceptional 6.1% |
| Mongolians | 100.0 /100 | #34 | Exceptional 6.1% |
| Immigrants | Korea | 100.0 /100 | #35 | Exceptional 6.1% |
| Immigrants | Russia | 100.0 /100 | #36 | Exceptional 6.0% |
| Immigrants | Austria | 100.0 /100 | #37 | Exceptional 6.0% |
| Immigrants | Norway | 100.0 /100 | #38 | Exceptional 6.0% |
| Immigrants | South Africa | 100.0 /100 | #39 | Exceptional 6.0% |
| Cambodians | 100.0 /100 | #40 | Exceptional 6.0% |
| New Zealanders | 100.0 /100 | #41 | Exceptional 6.0% |
| Estonians | 100.0 /100 | #42 | Exceptional 6.0% |
| Immigrants | Saudi Arabia | 100.0 /100 | #43 | Exceptional 5.9% |
| Argentineans | 100.0 /100 | #44 | Exceptional 5.9% |
| Immigrants | South Central Asia | 100.0 /100 | #45 | Exceptional 5.9% |
| Immigrants | Argentina | 100.0 /100 | #46 | Exceptional 5.9% |