American vs Immigrants from Bolivia 12th Grade, No Diploma
COMPARE
American
Immigrants from Bolivia
12th Grade, No Diploma
12th Grade, No Diploma Comparison
Americans
Immigrants from Bolivia
91.0%
12TH GRADE, NO DIPLOMA
32.6/ 100
METRIC RATING
188th/ 347
METRIC RANK
90.6%
12TH GRADE, NO DIPLOMA
12.3/ 100
METRIC RATING
206th/ 347
METRIC RANK
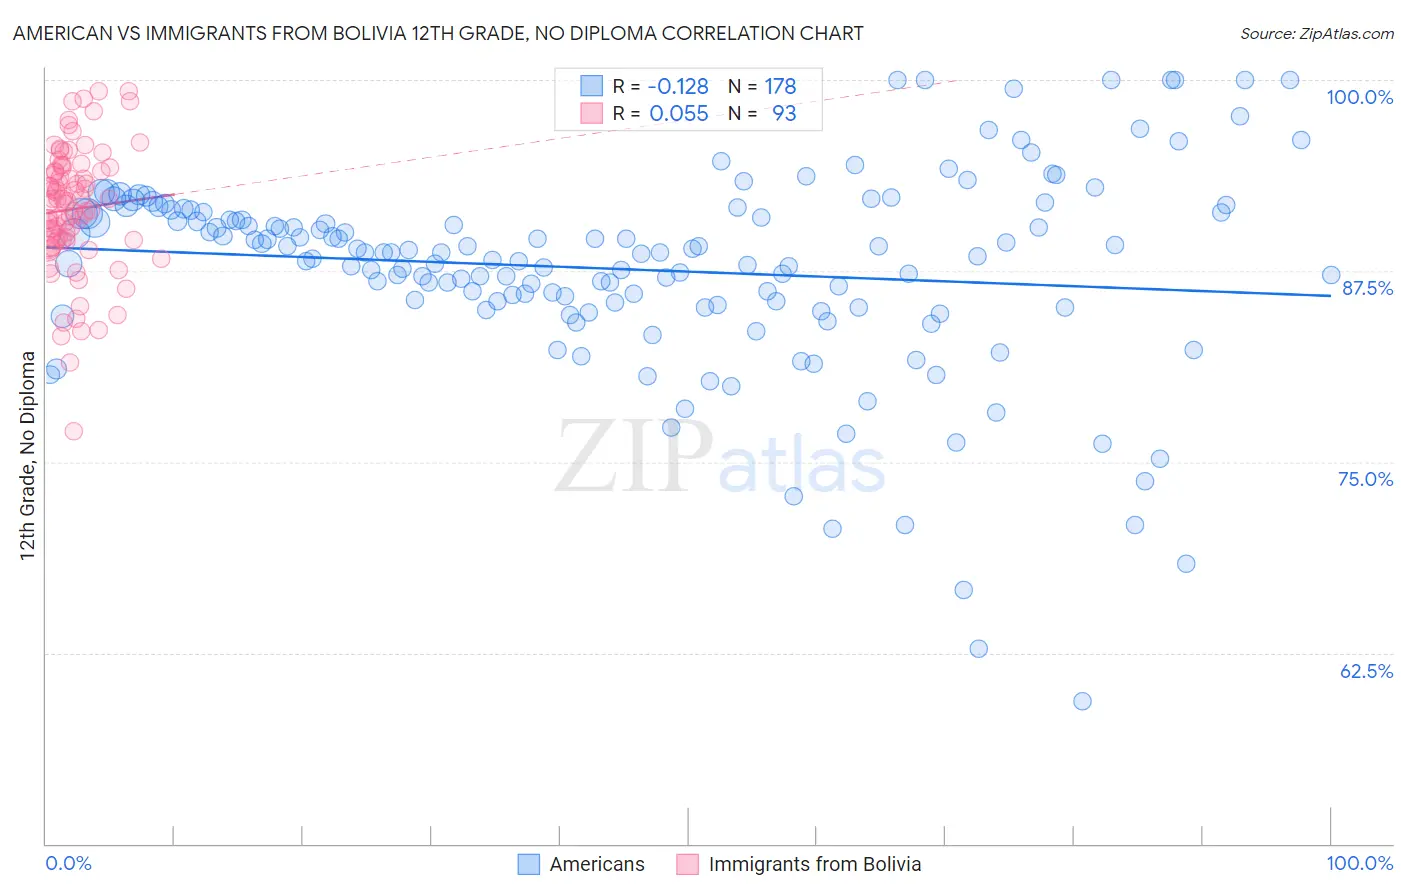
American vs Immigrants from Bolivia 12th Grade, No Diploma Correlation Chart
The statistical analysis conducted on geographies consisting of 581,993,188 people shows a poor negative correlation between the proportion of Americans and percentage of population with at least 12th grade (no diploma) education in the United States with a correlation coefficient (R) of -0.128 and weighted average of 91.0%. Similarly, the statistical analysis conducted on geographies consisting of 158,727,043 people shows a slight positive correlation between the proportion of Immigrants from Bolivia and percentage of population with at least 12th grade (no diploma) education in the United States with a correlation coefficient (R) of 0.055 and weighted average of 90.6%, a difference of 0.38%.
12th Grade, No Diploma Correlation Summary
| Measurement | American | Immigrants from Bolivia |
| Minimum | 59.3% | 77.0% |
| Maximum | 100.0% | 99.3% |
| Range | 40.7% | 22.3% |
| Mean | 87.6% | 91.5% |
| Median | 88.7% | 92.1% |
| Interquartile 25% (IQ1) | 85.3% | 89.5% |
| Interquartile 75% (IQ3) | 91.3% | 94.2% |
| Interquartile Range (IQR) | 6.1% | 4.6% |
| Standard Deviation (Sample) | 6.7% | 4.1% |
| Standard Deviation (Population) | 6.6% | 4.1% |
Demographics Similar to Americans and Immigrants from Bolivia by 12th Grade, No Diploma
In terms of 12th grade, no diploma, the demographic groups most similar to Americans are Potawatomi (91.0%, a difference of 0.0%), Immigrants from Uganda (90.9%, a difference of 0.010%), Afghan (90.9%, a difference of 0.040%), Moroccan (90.9%, a difference of 0.050%), and Immigrants from Eastern Africa (90.9%, a difference of 0.070%). Similarly, the demographic groups most similar to Immigrants from Bolivia are Armenian (90.6%, a difference of 0.020%), Immigrants from Sierra Leone (90.7%, a difference of 0.070%), French American Indian (90.7%, a difference of 0.080%), Tongan (90.7%, a difference of 0.10%), and Marshallese (90.7%, a difference of 0.14%).
| Demographics | Rating | Rank | 12th Grade, No Diploma |
| Potawatomi | 32.9 /100 | #187 | Fair 91.0% |
| Americans | 32.6 /100 | #188 | Fair 91.0% |
| Immigrants | Uganda | 31.6 /100 | #189 | Fair 90.9% |
| Afghans | 29.9 /100 | #190 | Fair 90.9% |
| Moroccans | 28.8 /100 | #191 | Fair 90.9% |
| Immigrants | Eastern Africa | 27.7 /100 | #192 | Fair 90.9% |
| Immigrants | Ethiopia | 27.2 /100 | #193 | Fair 90.9% |
| Immigrants | Oceania | 26.0 /100 | #194 | Fair 90.9% |
| Koreans | 24.5 /100 | #195 | Fair 90.8% |
| Panamanians | 22.8 /100 | #196 | Fair 90.8% |
| Immigrants | Sudan | 22.6 /100 | #197 | Fair 90.8% |
| Samoans | 20.4 /100 | #198 | Fair 90.8% |
| Immigrants | Southern Europe | 19.9 /100 | #199 | Poor 90.8% |
| Liberians | 19.8 /100 | #200 | Poor 90.8% |
| Hawaiians | 19.7 /100 | #201 | Poor 90.8% |
| Marshallese | 18.2 /100 | #202 | Poor 90.7% |
| Tongans | 16.1 /100 | #203 | Poor 90.7% |
| French American Indians | 15.5 /100 | #204 | Poor 90.7% |
| Immigrants | Sierra Leone | 14.9 /100 | #205 | Poor 90.7% |
| Immigrants | Bolivia | 12.3 /100 | #206 | Poor 90.6% |
| Armenians | 11.6 /100 | #207 | Poor 90.6% |