Hmong vs Immigrants from Colombia 6th Grade
COMPARE
Hmong
Immigrants from Colombia
6th Grade
6th Grade Comparison
Hmong
Immigrants from Colombia
97.4%
6TH GRADE
94.4/ 100
METRIC RATING
123rd/ 347
METRIC RANK
96.4%
6TH GRADE
0.3/ 100
METRIC RATING
263rd/ 347
METRIC RANK
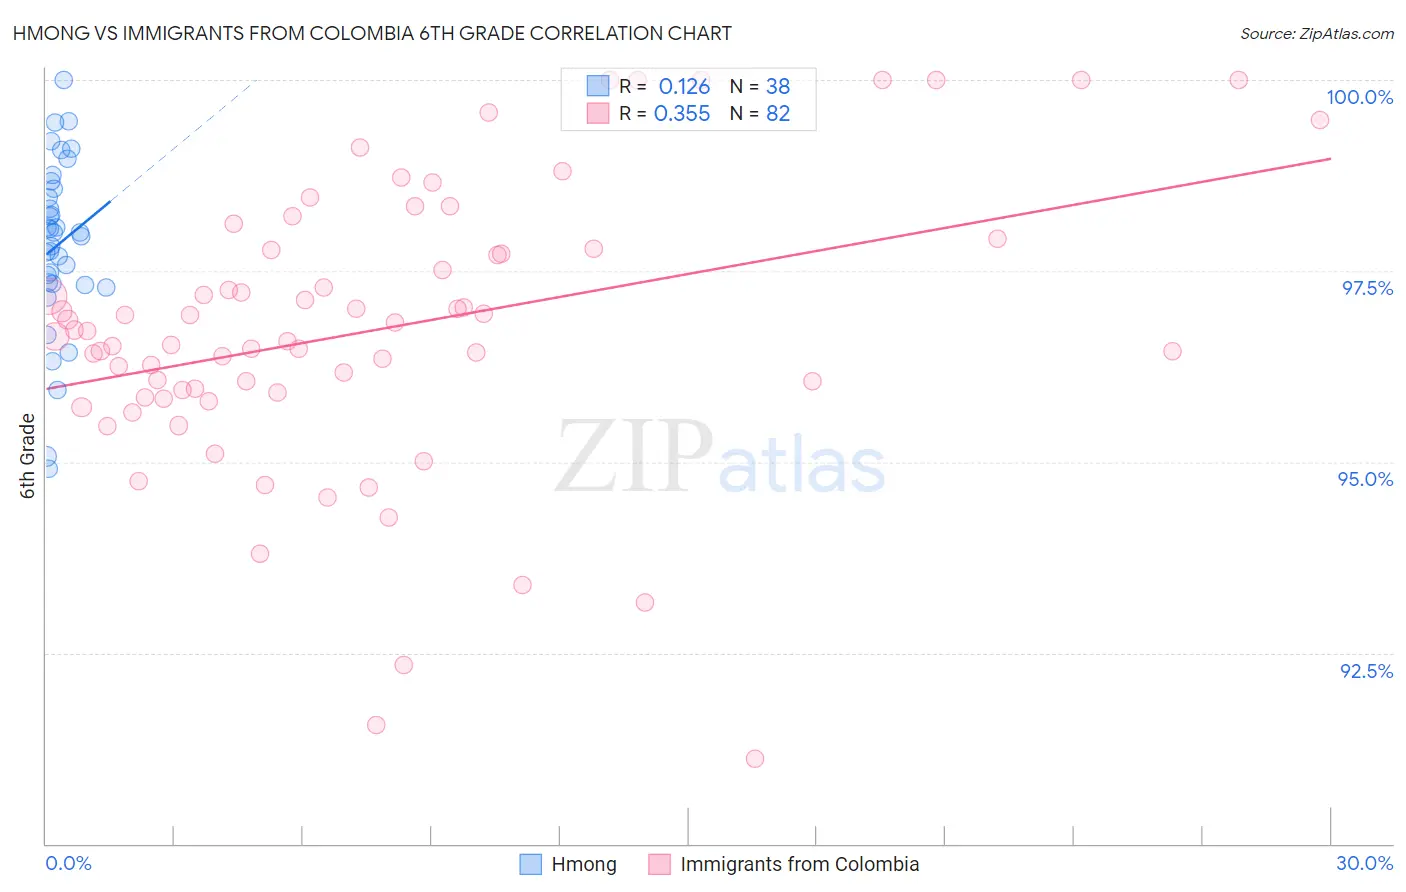
Hmong vs Immigrants from Colombia 6th Grade Correlation Chart
The statistical analysis conducted on geographies consisting of 24,672,093 people shows a poor positive correlation between the proportion of Hmong and percentage of population with at least 6th grade education in the United States with a correlation coefficient (R) of 0.126 and weighted average of 97.4%. Similarly, the statistical analysis conducted on geographies consisting of 378,598,469 people shows a mild positive correlation between the proportion of Immigrants from Colombia and percentage of population with at least 6th grade education in the United States with a correlation coefficient (R) of 0.355 and weighted average of 96.4%, a difference of 1.0%.
6th Grade Correlation Summary
| Measurement | Hmong | Immigrants from Colombia |
| Minimum | 94.9% | 91.1% |
| Maximum | 100.0% | 100.0% |
| Range | 5.1% | 8.9% |
| Mean | 97.8% | 96.7% |
| Median | 98.0% | 96.7% |
| Interquartile 25% (IQ1) | 97.3% | 95.9% |
| Interquartile 75% (IQ3) | 98.6% | 97.8% |
| Interquartile Range (IQR) | 1.2% | 1.9% |
| Standard Deviation (Sample) | 1.1% | 1.9% |
| Standard Deviation (Population) | 1.1% | 1.8% |
Similar Demographics by 6th Grade
Demographics Similar to Hmong by 6th Grade
In terms of 6th grade, the demographic groups most similar to Hmong are Immigrants from France (97.4%, a difference of 0.0%), Okinawan (97.4%, a difference of 0.0%), Immigrants from Zimbabwe (97.4%, a difference of 0.010%), Syrian (97.4%, a difference of 0.010%), and Immigrants from Norway (97.4%, a difference of 0.010%).
| Demographics | Rating | Rank | 6th Grade |
| Lebanese | 95.5 /100 | #116 | Exceptional 97.4% |
| Basques | 95.4 /100 | #117 | Exceptional 97.4% |
| Immigrants | Japan | 95.2 /100 | #118 | Exceptional 97.4% |
| Immigrants | Zimbabwe | 95.0 /100 | #119 | Exceptional 97.4% |
| Syrians | 94.8 /100 | #120 | Exceptional 97.4% |
| Immigrants | Norway | 94.7 /100 | #121 | Exceptional 97.4% |
| Immigrants | France | 94.5 /100 | #122 | Exceptional 97.4% |
| Hmong | 94.4 /100 | #123 | Exceptional 97.4% |
| Okinawans | 94.2 /100 | #124 | Exceptional 97.4% |
| Spanish | 93.7 /100 | #125 | Exceptional 97.3% |
| Immigrants | Bulgaria | 93.6 /100 | #126 | Exceptional 97.3% |
| Immigrants | Croatia | 93.1 /100 | #127 | Exceptional 97.3% |
| Immigrants | Romania | 92.0 /100 | #128 | Exceptional 97.3% |
| Immigrants | Serbia | 91.9 /100 | #129 | Exceptional 97.3% |
| Cambodians | 91.8 /100 | #130 | Exceptional 97.3% |
Demographics Similar to Immigrants from Colombia by 6th Grade
In terms of 6th grade, the demographic groups most similar to Immigrants from Colombia are Armenian (96.4%, a difference of 0.0%), Immigrants from Nigeria (96.4%, a difference of 0.010%), Immigrants from Jamaica (96.4%, a difference of 0.010%), Ghanaian (96.4%, a difference of 0.020%), and Afghan (96.4%, a difference of 0.020%).
| Demographics | Rating | Rank | 6th Grade |
| U.S. Virgin Islanders | 0.5 /100 | #256 | Tragic 96.5% |
| Taiwanese | 0.5 /100 | #257 | Tragic 96.5% |
| Immigrants | China | 0.4 /100 | #258 | Tragic 96.4% |
| South Americans | 0.4 /100 | #259 | Tragic 96.4% |
| Peruvians | 0.4 /100 | #260 | Tragic 96.4% |
| Immigrants | Sierra Leone | 0.4 /100 | #261 | Tragic 96.4% |
| Immigrants | Nigeria | 0.3 /100 | #262 | Tragic 96.4% |
| Immigrants | Colombia | 0.3 /100 | #263 | Tragic 96.4% |
| Armenians | 0.3 /100 | #264 | Tragic 96.4% |
| Immigrants | Jamaica | 0.2 /100 | #265 | Tragic 96.4% |
| Ghanaians | 0.2 /100 | #266 | Tragic 96.4% |
| Afghans | 0.2 /100 | #267 | Tragic 96.4% |
| Immigrants | Uzbekistan | 0.2 /100 | #268 | Tragic 96.3% |
| West Indians | 0.2 /100 | #269 | Tragic 96.3% |
| Immigrants | South America | 0.2 /100 | #270 | Tragic 96.3% |