Immigrants from Armenia vs Spanish American 8th Grade
COMPARE
Immigrants from Armenia
Spanish American
8th Grade
8th Grade Comparison
Immigrants from Armenia
Spanish Americans
92.3%
8TH GRADE
0.0/ 100
METRIC RATING
330th/ 347
METRIC RANK
95.4%
8TH GRADE
8.0/ 100
METRIC RATING
219th/ 347
METRIC RANK
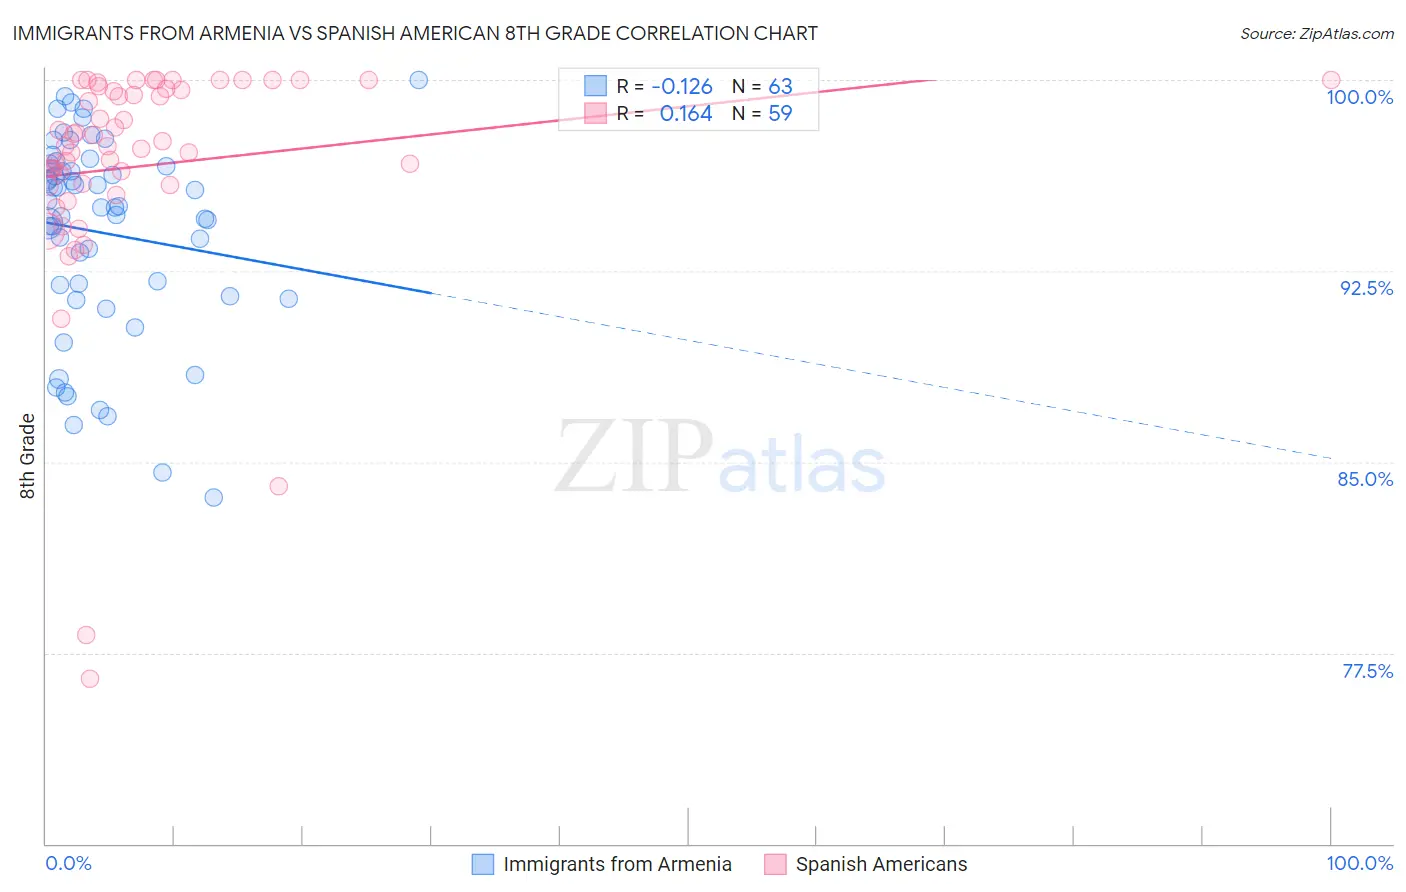
Immigrants from Armenia vs Spanish American 8th Grade Correlation Chart
The statistical analysis conducted on geographies consisting of 97,657,339 people shows a poor negative correlation between the proportion of Immigrants from Armenia and percentage of population with at least 8th grade education in the United States with a correlation coefficient (R) of -0.126 and weighted average of 92.3%. Similarly, the statistical analysis conducted on geographies consisting of 103,168,542 people shows a poor positive correlation between the proportion of Spanish Americans and percentage of population with at least 8th grade education in the United States with a correlation coefficient (R) of 0.164 and weighted average of 95.4%, a difference of 3.3%.
8th Grade Correlation Summary
| Measurement | Immigrants from Armenia | Spanish American |
| Minimum | 83.6% | 76.5% |
| Maximum | 100.0% | 100.0% |
| Range | 16.4% | 23.5% |
| Mean | 94.0% | 96.6% |
| Median | 95.0% | 97.4% |
| Interquartile 25% (IQ1) | 91.5% | 95.9% |
| Interquartile 75% (IQ3) | 96.6% | 99.7% |
| Interquartile Range (IQR) | 5.1% | 3.8% |
| Standard Deviation (Sample) | 3.9% | 4.6% |
| Standard Deviation (Population) | 3.9% | 4.6% |
Similar Demographics by 8th Grade
Demographics Similar to Immigrants from Armenia by 8th Grade
In terms of 8th grade, the demographic groups most similar to Immigrants from Armenia are Honduran (92.3%, a difference of 0.010%), Immigrants from Dominican Republic (92.3%, a difference of 0.020%), Immigrants from Cabo Verde (92.4%, a difference of 0.090%), Hispanic or Latino (92.2%, a difference of 0.14%), and Immigrants from Nicaragua (92.5%, a difference of 0.15%).
| Demographics | Rating | Rank | 8th Grade |
| Immigrants | Belize | 0.0 /100 | #323 | Tragic 92.9% |
| Nepalese | 0.0 /100 | #324 | Tragic 92.8% |
| Dominicans | 0.0 /100 | #325 | Tragic 92.8% |
| Central American Indians | 0.0 /100 | #326 | Tragic 92.7% |
| Immigrants | Azores | 0.0 /100 | #327 | Tragic 92.5% |
| Immigrants | Nicaragua | 0.0 /100 | #328 | Tragic 92.5% |
| Immigrants | Cabo Verde | 0.0 /100 | #329 | Tragic 92.4% |
| Immigrants | Armenia | 0.0 /100 | #330 | Tragic 92.3% |
| Hondurans | 0.0 /100 | #331 | Tragic 92.3% |
| Immigrants | Dominican Republic | 0.0 /100 | #332 | Tragic 92.3% |
| Hispanics or Latinos | 0.0 /100 | #333 | Tragic 92.2% |
| Immigrants | Yemen | 0.0 /100 | #334 | Tragic 92.1% |
| Mexican American Indians | 0.0 /100 | #335 | Tragic 92.1% |
| Immigrants | Honduras | 0.0 /100 | #336 | Tragic 91.9% |
| Immigrants | Latin America | 0.0 /100 | #337 | Tragic 91.7% |
Demographics Similar to Spanish Americans by 8th Grade
In terms of 8th grade, the demographic groups most similar to Spanish Americans are Dutch West Indian (95.4%, a difference of 0.0%), Samoan (95.4%, a difference of 0.010%), Immigrants from Eastern Asia (95.4%, a difference of 0.010%), Immigrants from Southern Europe (95.3%, a difference of 0.010%), and Immigrants from Syria (95.3%, a difference of 0.010%).
| Demographics | Rating | Rank | 8th Grade |
| Immigrants | Pakistan | 9.7 /100 | #212 | Tragic 95.4% |
| Laotians | 9.0 /100 | #213 | Tragic 95.4% |
| Immigrants | Chile | 9.0 /100 | #214 | Tragic 95.4% |
| Immigrants | Liberia | 8.9 /100 | #215 | Tragic 95.4% |
| Samoans | 8.4 /100 | #216 | Tragic 95.4% |
| Immigrants | Eastern Asia | 8.3 /100 | #217 | Tragic 95.4% |
| Dutch West Indians | 8.1 /100 | #218 | Tragic 95.4% |
| Spanish Americans | 8.0 /100 | #219 | Tragic 95.4% |
| Immigrants | Southern Europe | 7.7 /100 | #220 | Tragic 95.3% |
| Immigrants | Syria | 7.4 /100 | #221 | Tragic 95.3% |
| Immigrants | Malaysia | 7.3 /100 | #222 | Tragic 95.3% |
| Immigrants | Oceania | 7.1 /100 | #223 | Tragic 95.3% |
| Immigrants | Western Asia | 6.0 /100 | #224 | Tragic 95.3% |
| Sub-Saharan Africans | 6.0 /100 | #225 | Tragic 95.3% |
| Navajo | 5.7 /100 | #226 | Tragic 95.3% |