Nicaraguan vs Immigrants from Zaire Nursery School
COMPARE
Nicaraguan
Immigrants from Zaire
Nursery School
Nursery School Comparison
Nicaraguans
Immigrants from Zaire
97.1%
NURSERY SCHOOL
0.0/ 100
METRIC RATING
303rd/ 347
METRIC RANK
97.8%
NURSERY SCHOOL
4.4/ 100
METRIC RATING
220th/ 347
METRIC RANK
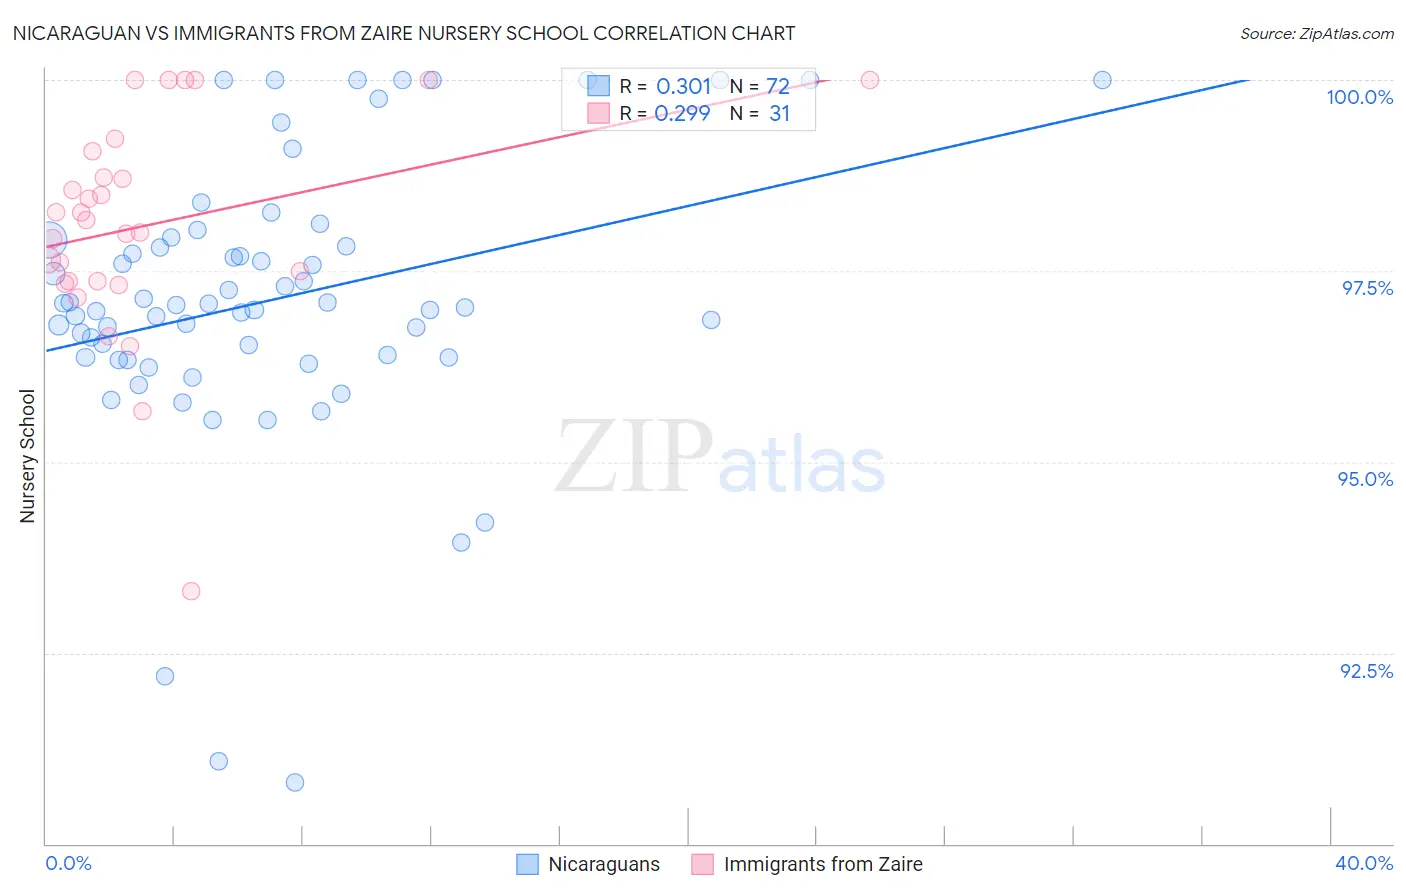
Nicaraguan vs Immigrants from Zaire Nursery School Correlation Chart
The statistical analysis conducted on geographies consisting of 285,711,389 people shows a mild positive correlation between the proportion of Nicaraguans and percentage of population with at least nursery school education in the United States with a correlation coefficient (R) of 0.301 and weighted average of 97.1%. Similarly, the statistical analysis conducted on geographies consisting of 107,250,996 people shows a weak positive correlation between the proportion of Immigrants from Zaire and percentage of population with at least nursery school education in the United States with a correlation coefficient (R) of 0.299 and weighted average of 97.8%, a difference of 0.69%.
Nursery School Correlation Summary
| Measurement | Nicaraguan | Immigrants from Zaire |
| Minimum | 90.8% | 93.3% |
| Maximum | 100.0% | 100.0% |
| Range | 9.2% | 6.7% |
| Mean | 97.1% | 98.1% |
| Median | 97.0% | 98.2% |
| Interquartile 25% (IQ1) | 96.4% | 97.4% |
| Interquartile 75% (IQ3) | 97.9% | 99.1% |
| Interquartile Range (IQR) | 1.5% | 1.7% |
| Standard Deviation (Sample) | 1.8% | 1.4% |
| Standard Deviation (Population) | 1.8% | 1.4% |
Similar Demographics by Nursery School
Demographics Similar to Nicaraguans by Nursery School
In terms of nursery school, the demographic groups most similar to Nicaraguans are Ecuadorian (97.1%, a difference of 0.010%), Somali (97.1%, a difference of 0.010%), Immigrants from Caribbean (97.1%, a difference of 0.030%), Immigrants from South Eastern Asia (97.1%, a difference of 0.060%), and Belizean (97.0%, a difference of 0.070%).
| Demographics | Rating | Rank | Nursery School |
| Immigrants | Eritrea | 0.0 /100 | #296 | Tragic 97.2% |
| Immigrants | Cuba | 0.0 /100 | #297 | Tragic 97.2% |
| Central American Indians | 0.0 /100 | #298 | Tragic 97.2% |
| Immigrants | Dominica | 0.0 /100 | #299 | Tragic 97.2% |
| Haitians | 0.0 /100 | #300 | Tragic 97.2% |
| Immigrants | South Eastern Asia | 0.0 /100 | #301 | Tragic 97.1% |
| Immigrants | Caribbean | 0.0 /100 | #302 | Tragic 97.1% |
| Nicaraguans | 0.0 /100 | #303 | Tragic 97.1% |
| Ecuadorians | 0.0 /100 | #304 | Tragic 97.1% |
| Somalis | 0.0 /100 | #305 | Tragic 97.1% |
| Belizeans | 0.0 /100 | #306 | Tragic 97.0% |
| Hispanics or Latinos | 0.0 /100 | #307 | Tragic 97.0% |
| Immigrants | Haiti | 0.0 /100 | #308 | Tragic 97.0% |
| Immigrants | Somalia | 0.0 /100 | #309 | Tragic 97.0% |
| Guyanese | 0.0 /100 | #310 | Tragic 97.0% |
Demographics Similar to Immigrants from Zaire by Nursery School
In terms of nursery school, the demographic groups most similar to Immigrants from Zaire are Tongan (97.8%, a difference of 0.0%), Immigrants from Morocco (97.8%, a difference of 0.010%), Immigrants from Syria (97.7%, a difference of 0.010%), Immigrants from Sudan (97.7%, a difference of 0.010%), and Immigrants from Nepal (97.7%, a difference of 0.010%).
| Demographics | Rating | Rank | Nursery School |
| Moroccans | 8.3 /100 | #213 | Tragic 97.8% |
| South American Indians | 8.0 /100 | #214 | Tragic 97.8% |
| Bahamians | 7.4 /100 | #215 | Tragic 97.8% |
| Uruguayans | 7.1 /100 | #216 | Tragic 97.8% |
| Samoans | 6.3 /100 | #217 | Tragic 97.8% |
| Immigrants | Panama | 5.3 /100 | #218 | Tragic 97.8% |
| Immigrants | Morocco | 5.1 /100 | #219 | Tragic 97.8% |
| Immigrants | Zaire | 4.4 /100 | #220 | Tragic 97.8% |
| Tongans | 4.3 /100 | #221 | Tragic 97.8% |
| Immigrants | Syria | 4.0 /100 | #222 | Tragic 97.7% |
| Immigrants | Sudan | 3.9 /100 | #223 | Tragic 97.7% |
| Immigrants | Nepal | 3.6 /100 | #224 | Tragic 97.7% |
| Immigrants | Costa Rica | 3.5 /100 | #225 | Tragic 97.7% |
| Iraqis | 3.5 /100 | #226 | Tragic 97.7% |
| Sub-Saharan Africans | 3.2 /100 | #227 | Tragic 97.7% |