Alaskan Athabascan vs Venezuelan High School Diploma
COMPARE
Alaskan Athabascan
Venezuelan
High School Diploma
High School Diploma Comparison
Alaskan Athabascans
Venezuelans
90.9%
HIGH SCHOOL DIPLOMA
99.4/ 100
METRIC RATING
71st/ 347
METRIC RANK
89.1%
HIGH SCHOOL DIPLOMA
43.6/ 100
METRIC RATING
181st/ 347
METRIC RANK
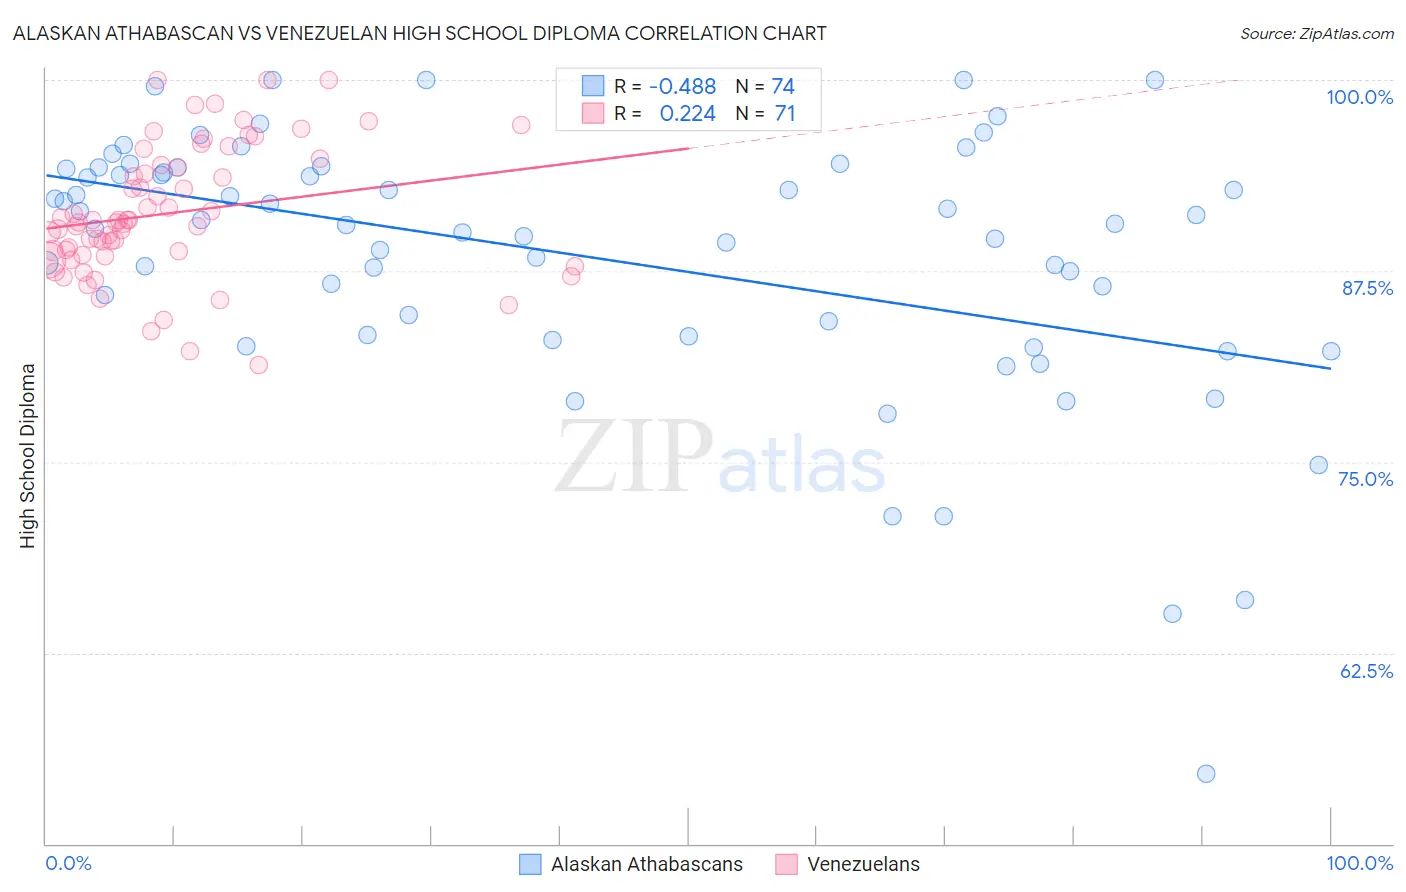
Alaskan Athabascan vs Venezuelan High School Diploma Correlation Chart
The statistical analysis conducted on geographies consisting of 45,820,221 people shows a moderate negative correlation between the proportion of Alaskan Athabascans and percentage of population with at least high school diploma education in the United States with a correlation coefficient (R) of -0.488 and weighted average of 90.9%. Similarly, the statistical analysis conducted on geographies consisting of 306,323,638 people shows a weak positive correlation between the proportion of Venezuelans and percentage of population with at least high school diploma education in the United States with a correlation coefficient (R) of 0.224 and weighted average of 89.1%, a difference of 2.1%.
High School Diploma Correlation Summary
| Measurement | Alaskan Athabascan | Venezuelan |
| Minimum | 54.5% | 81.3% |
| Maximum | 100.0% | 100.0% |
| Range | 45.5% | 18.7% |
| Mean | 88.4% | 91.3% |
| Median | 90.5% | 90.7% |
| Interquartile 25% (IQ1) | 83.3% | 88.5% |
| Interquartile 75% (IQ3) | 94.2% | 94.4% |
| Interquartile Range (IQR) | 10.9% | 5.9% |
| Standard Deviation (Sample) | 8.6% | 4.3% |
| Standard Deviation (Population) | 8.5% | 4.2% |
Similar Demographics by High School Diploma
Demographics Similar to Alaskan Athabascans by High School Diploma
In terms of high school diploma, the demographic groups most similar to Alaskan Athabascans are Immigrants from Latvia (90.9%, a difference of 0.0%), Soviet Union (90.9%, a difference of 0.0%), French Canadian (90.9%, a difference of 0.010%), Immigrants from South Central Asia (90.9%, a difference of 0.030%), and Czechoslovakian (90.9%, a difference of 0.040%).
| Demographics | Rating | Rank | High School Diploma |
| Ukrainians | 99.6 /100 | #64 | Exceptional 91.0% |
| Immigrants | South Africa | 99.6 /100 | #65 | Exceptional 91.0% |
| French | 99.5 /100 | #66 | Exceptional 91.0% |
| Immigrants | Iran | 99.5 /100 | #67 | Exceptional 90.9% |
| Czechoslovakians | 99.5 /100 | #68 | Exceptional 90.9% |
| French Canadians | 99.5 /100 | #69 | Exceptional 90.9% |
| Immigrants | Latvia | 99.5 /100 | #70 | Exceptional 90.9% |
| Alaskan Athabascans | 99.4 /100 | #71 | Exceptional 90.9% |
| Soviet Union | 99.4 /100 | #72 | Exceptional 90.9% |
| Immigrants | South Central Asia | 99.4 /100 | #73 | Exceptional 90.9% |
| Immigrants | Czechoslovakia | 99.4 /100 | #74 | Exceptional 90.9% |
| Cambodians | 99.4 /100 | #75 | Exceptional 90.8% |
| Hungarians | 99.3 /100 | #76 | Exceptional 90.8% |
| Native Hawaiians | 99.3 /100 | #77 | Exceptional 90.8% |
| Burmese | 99.3 /100 | #78 | Exceptional 90.8% |
Demographics Similar to Venezuelans by High School Diploma
In terms of high school diploma, the demographic groups most similar to Venezuelans are Spaniard (89.1%, a difference of 0.0%), Bolivian (89.1%, a difference of 0.020%), Potawatomi (89.0%, a difference of 0.020%), American (89.1%, a difference of 0.050%), and Sudanese (89.1%, a difference of 0.070%).
| Demographics | Rating | Rank | High School Diploma |
| Hmong | 50.0 /100 | #174 | Average 89.1% |
| Immigrants | Western Asia | 49.0 /100 | #175 | Average 89.1% |
| Osage | 48.9 /100 | #176 | Average 89.1% |
| Sudanese | 48.5 /100 | #177 | Average 89.1% |
| Sierra Leoneans | 48.4 /100 | #178 | Average 89.1% |
| Americans | 47.2 /100 | #179 | Average 89.1% |
| Bolivians | 45.2 /100 | #180 | Average 89.1% |
| Venezuelans | 43.6 /100 | #181 | Average 89.1% |
| Spaniards | 43.4 /100 | #182 | Average 89.1% |
| Potawatomi | 42.5 /100 | #183 | Average 89.0% |
| Immigrants | Syria | 39.2 /100 | #184 | Fair 89.0% |
| Ethiopians | 37.0 /100 | #185 | Fair 89.0% |
| Immigrants | Eastern Africa | 35.8 /100 | #186 | Fair 88.9% |
| Guamanians/Chamorros | 35.5 /100 | #187 | Fair 88.9% |
| Immigrants | Sudan | 33.4 /100 | #188 | Fair 88.9% |