Alaskan Athabascan vs Puget Sound Salish 2nd Grade
COMPARE
Alaskan Athabascan
Puget Sound Salish
2nd Grade
2nd Grade Comparison
Alaskan Athabascans
Puget Sound Salish
98.7%
2ND GRADE
100.0/ 100
METRIC RATING
5th/ 347
METRIC RANK
98.2%
2ND GRADE
98.0/ 100
METRIC RATING
101st/ 347
METRIC RANK
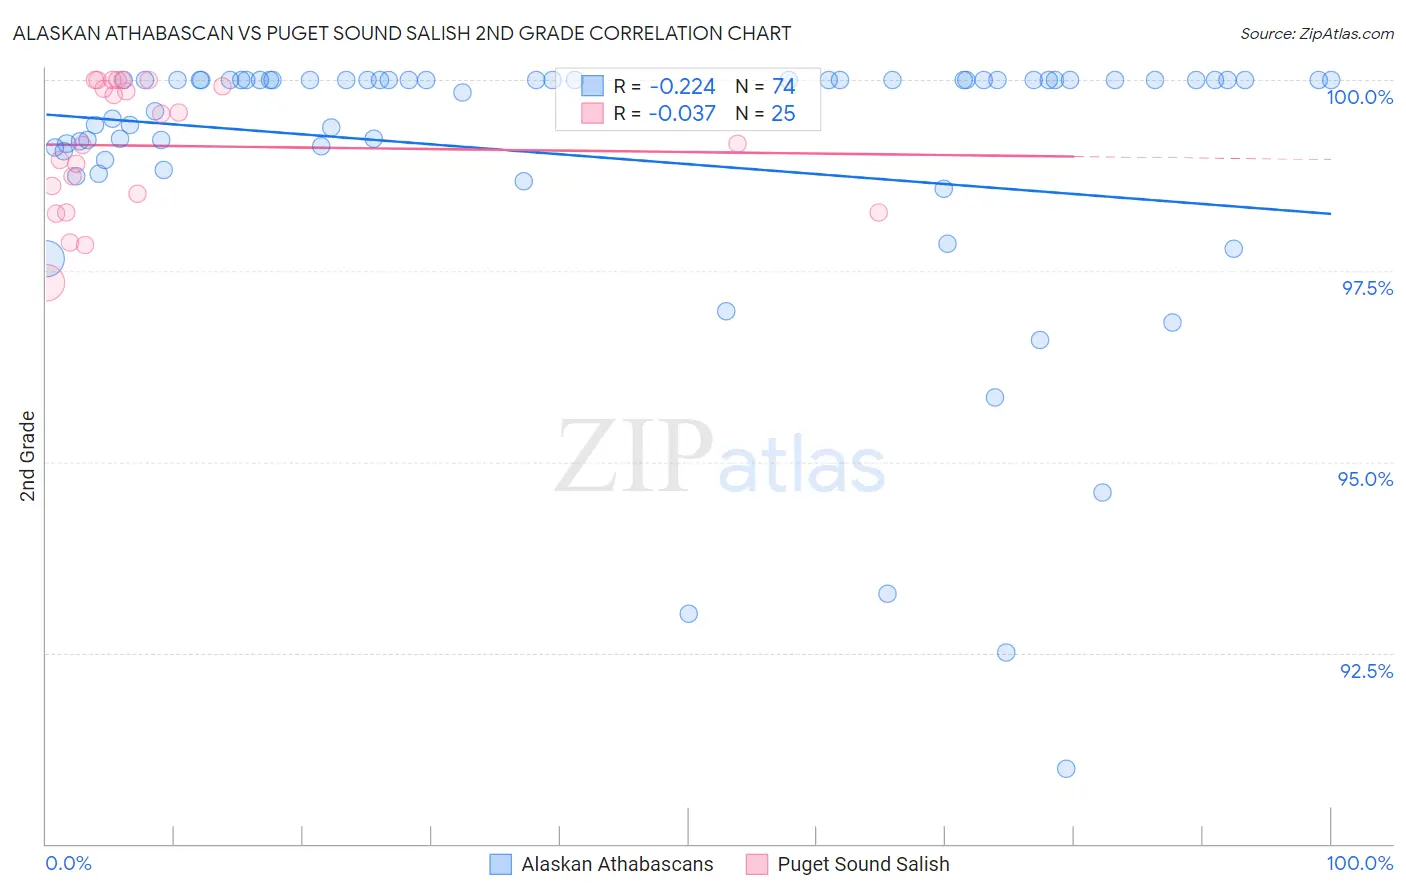
Alaskan Athabascan vs Puget Sound Salish 2nd Grade Correlation Chart
The statistical analysis conducted on geographies consisting of 45,820,365 people shows a weak negative correlation between the proportion of Alaskan Athabascans and percentage of population with at least 2nd grade education in the United States with a correlation coefficient (R) of -0.224 and weighted average of 98.7%. Similarly, the statistical analysis conducted on geographies consisting of 46,155,746 people shows no correlation between the proportion of Puget Sound Salish and percentage of population with at least 2nd grade education in the United States with a correlation coefficient (R) of -0.037 and weighted average of 98.2%, a difference of 0.57%.
2nd Grade Correlation Summary
| Measurement | Alaskan Athabascan | Puget Sound Salish |
| Minimum | 91.0% | 97.3% |
| Maximum | 100.0% | 100.0% |
| Range | 9.0% | 2.7% |
| Mean | 99.0% | 99.1% |
| Median | 100.0% | 99.2% |
| Interquartile 25% (IQ1) | 99.1% | 98.4% |
| Interquartile 75% (IQ3) | 100.0% | 100.0% |
| Interquartile Range (IQR) | 0.94% | 1.6% |
| Standard Deviation (Sample) | 1.9% | 0.83% |
| Standard Deviation (Population) | 1.9% | 0.82% |
Similar Demographics by 2nd Grade
Demographics Similar to Alaskan Athabascans by 2nd Grade
In terms of 2nd grade, the demographic groups most similar to Alaskan Athabascans are Alaska Native (98.7%, a difference of 0.040%), Norwegian (98.7%, a difference of 0.050%), German (98.7%, a difference of 0.070%), Slovak (98.7%, a difference of 0.070%), and Tsimshian (98.8%, a difference of 0.080%).
| Demographics | Rating | Rank | 2nd Grade |
| Crow | 100.0 /100 | #1 | Exceptional 99.6% |
| Yup'ik | 100.0 /100 | #2 | Exceptional 99.2% |
| Inupiat | 100.0 /100 | #3 | Exceptional 98.8% |
| Tsimshian | 100.0 /100 | #4 | Exceptional 98.8% |
| Alaskan Athabascans | 100.0 /100 | #5 | Exceptional 98.7% |
| Alaska Natives | 100.0 /100 | #6 | Exceptional 98.7% |
| Norwegians | 100.0 /100 | #7 | Exceptional 98.7% |
| Germans | 100.0 /100 | #8 | Exceptional 98.7% |
| Slovaks | 100.0 /100 | #9 | Exceptional 98.7% |
| Slovenes | 100.0 /100 | #10 | Exceptional 98.6% |
| Tlingit-Haida | 100.0 /100 | #11 | Exceptional 98.6% |
| Carpatho Rusyns | 100.0 /100 | #12 | Exceptional 98.6% |
| English | 100.0 /100 | #13 | Exceptional 98.6% |
| Swedes | 100.0 /100 | #14 | Exceptional 98.6% |
| Scottish | 100.0 /100 | #15 | Exceptional 98.6% |
Demographics Similar to Puget Sound Salish by 2nd Grade
In terms of 2nd grade, the demographic groups most similar to Puget Sound Salish are Immigrants from Ireland (98.2%, a difference of 0.0%), Romanian (98.2%, a difference of 0.0%), Cree (98.2%, a difference of 0.0%), Choctaw (98.2%, a difference of 0.010%), and Nonimmigrants (98.2%, a difference of 0.010%).
| Demographics | Rating | Rank | 2nd Grade |
| Immigrants | Germany | 98.6 /100 | #94 | Exceptional 98.2% |
| South Africans | 98.6 /100 | #95 | Exceptional 98.2% |
| Cypriots | 98.4 /100 | #96 | Exceptional 98.2% |
| Choctaw | 98.3 /100 | #97 | Exceptional 98.2% |
| Immigrants | Nonimmigrants | 98.3 /100 | #98 | Exceptional 98.2% |
| Immigrants | Ireland | 98.0 /100 | #99 | Exceptional 98.2% |
| Romanians | 98.0 /100 | #100 | Exceptional 98.2% |
| Puget Sound Salish | 98.0 /100 | #101 | Exceptional 98.2% |
| Cree | 98.0 /100 | #102 | Exceptional 98.2% |
| Pima | 97.6 /100 | #103 | Exceptional 98.2% |
| Turks | 97.6 /100 | #104 | Exceptional 98.2% |
| Yugoslavians | 97.5 /100 | #105 | Exceptional 98.2% |
| Bhutanese | 97.5 /100 | #106 | Exceptional 98.1% |
| German Russians | 97.4 /100 | #107 | Exceptional 98.1% |
| Immigrants | Switzerland | 97.3 /100 | #108 | Exceptional 98.1% |