African vs Ukrainian Child Poverty Among Boys Under 16
COMPARE
African
Ukrainian
Child Poverty Among Boys Under 16
Child Poverty Among Boys Under 16 Comparison
Africans
Ukrainians
21.7%
CHILD POVERTY AMONG BOYS UNDER 16
0.0/ 100
METRIC RATING
317th/ 347
METRIC RANK
14.7%
CHILD POVERTY AMONG BOYS UNDER 16
97.6/ 100
METRIC RATING
82nd/ 347
METRIC RANK
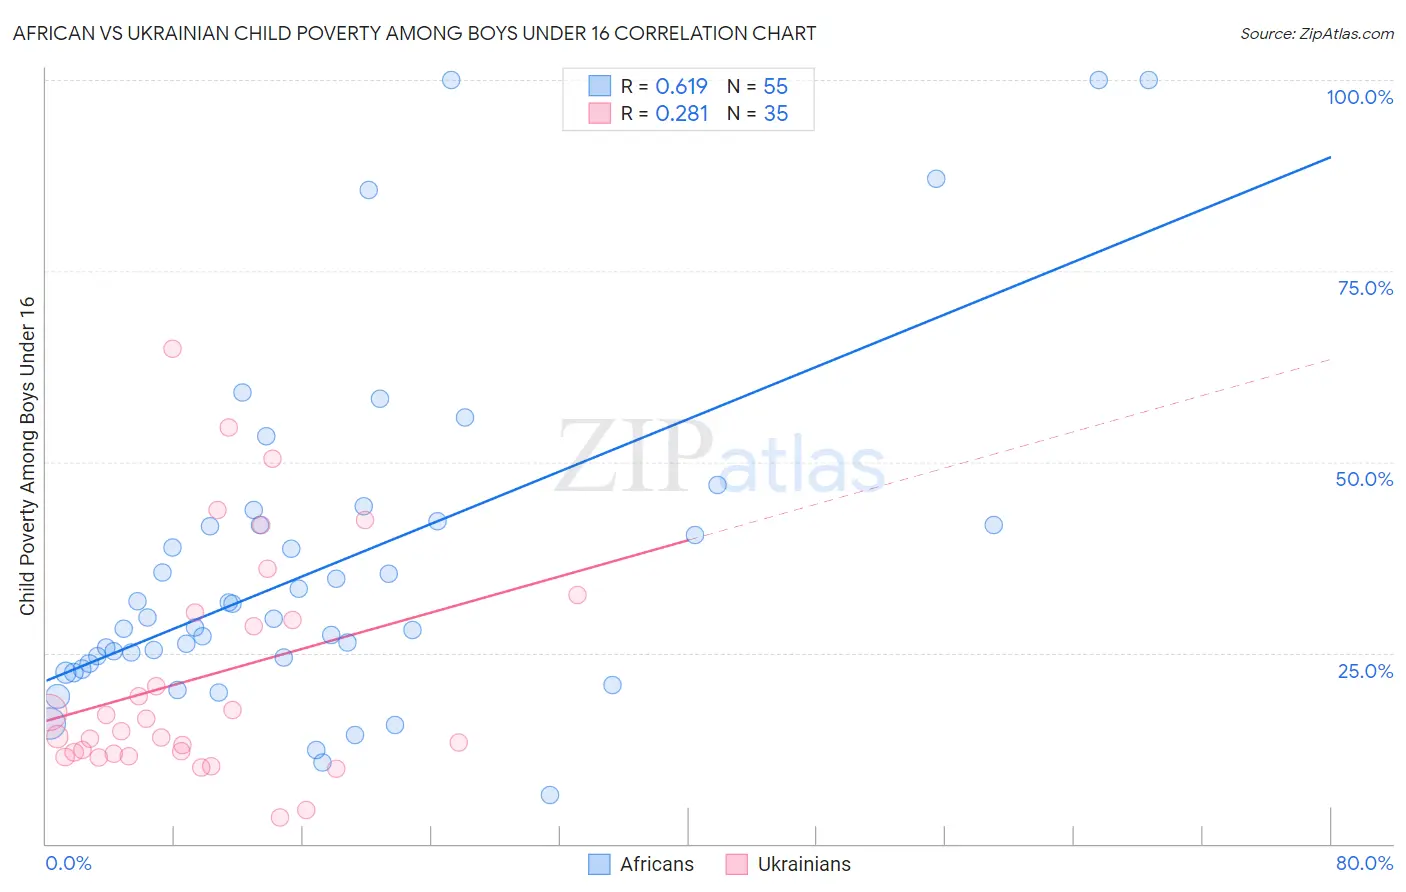
African vs Ukrainian Child Poverty Among Boys Under 16 Correlation Chart
The statistical analysis conducted on geographies consisting of 463,090,980 people shows a significant positive correlation between the proportion of Africans and poverty level among boys under the age of 16 in the United States with a correlation coefficient (R) of 0.619 and weighted average of 21.7%. Similarly, the statistical analysis conducted on geographies consisting of 436,859,544 people shows a weak positive correlation between the proportion of Ukrainians and poverty level among boys under the age of 16 in the United States with a correlation coefficient (R) of 0.281 and weighted average of 14.7%, a difference of 47.4%.
Child Poverty Among Boys Under 16 Correlation Summary
| Measurement | African | Ukrainian |
| Minimum | 6.5% | 3.5% |
| Maximum | 100.0% | 64.8% |
| Range | 93.5% | 61.3% |
| Mean | 36.4% | 21.8% |
| Median | 29.5% | 14.7% |
| Interquartile 25% (IQ1) | 23.6% | 11.7% |
| Interquartile 75% (IQ3) | 41.7% | 30.2% |
| Interquartile Range (IQR) | 18.1% | 18.5% |
| Standard Deviation (Sample) | 21.9% | 15.1% |
| Standard Deviation (Population) | 21.7% | 14.9% |
Similar Demographics by Child Poverty Among Boys Under 16
Demographics Similar to Africans by Child Poverty Among Boys Under 16
In terms of child poverty among boys under 16, the demographic groups most similar to Africans are Yakama (21.7%, a difference of 0.060%), Menominee (21.7%, a difference of 0.080%), Immigrants from Somalia (21.7%, a difference of 0.090%), Dutch West Indian (21.8%, a difference of 0.54%), and Ute (21.6%, a difference of 0.69%).
| Demographics | Rating | Rank | Child Poverty Among Boys Under 16 |
| Creek | 0.0 /100 | #310 | Tragic 21.5% |
| Bahamians | 0.0 /100 | #311 | Tragic 21.6% |
| Immigrants | Guatemala | 0.0 /100 | #312 | Tragic 21.6% |
| British West Indians | 0.0 /100 | #313 | Tragic 21.6% |
| Ute | 0.0 /100 | #314 | Tragic 21.6% |
| Immigrants | Somalia | 0.0 /100 | #315 | Tragic 21.7% |
| Menominee | 0.0 /100 | #316 | Tragic 21.7% |
| Africans | 0.0 /100 | #317 | Tragic 21.7% |
| Yakama | 0.0 /100 | #318 | Tragic 21.7% |
| Dutch West Indians | 0.0 /100 | #319 | Tragic 21.8% |
| U.S. Virgin Islanders | 0.0 /100 | #320 | Tragic 22.0% |
| Cajuns | 0.0 /100 | #321 | Tragic 22.2% |
| Immigrants | Dominica | 0.0 /100 | #322 | Tragic 22.2% |
| Hondurans | 0.0 /100 | #323 | Tragic 22.3% |
| Immigrants | Congo | 0.0 /100 | #324 | Tragic 22.4% |
Demographics Similar to Ukrainians by Child Poverty Among Boys Under 16
In terms of child poverty among boys under 16, the demographic groups most similar to Ukrainians are Immigrants from Canada (14.7%, a difference of 0.020%), Immigrants from Russia (14.7%, a difference of 0.16%), Immigrants from South Africa (14.8%, a difference of 0.23%), Immigrants from Eastern Europe (14.7%, a difference of 0.24%), and Egyptian (14.7%, a difference of 0.35%).
| Demographics | Rating | Rank | Child Poverty Among Boys Under 16 |
| Immigrants | Poland | 97.9 /100 | #75 | Exceptional 14.7% |
| Immigrants | Croatia | 97.9 /100 | #76 | Exceptional 14.7% |
| Macedonians | 97.9 /100 | #77 | Exceptional 14.7% |
| Egyptians | 97.8 /100 | #78 | Exceptional 14.7% |
| Immigrants | Eastern Europe | 97.8 /100 | #79 | Exceptional 14.7% |
| Immigrants | Russia | 97.7 /100 | #80 | Exceptional 14.7% |
| Immigrants | Canada | 97.6 /100 | #81 | Exceptional 14.7% |
| Ukrainians | 97.6 /100 | #82 | Exceptional 14.7% |
| Immigrants | South Africa | 97.4 /100 | #83 | Exceptional 14.8% |
| Swiss | 97.3 /100 | #84 | Exceptional 14.8% |
| Taiwanese | 97.3 /100 | #85 | Exceptional 14.8% |
| Germans | 97.2 /100 | #86 | Exceptional 14.8% |
| Northern Europeans | 97.2 /100 | #87 | Exceptional 14.8% |
| Immigrants | North America | 97.1 /100 | #88 | Exceptional 14.8% |
| Immigrants | Argentina | 97.1 /100 | #89 | Exceptional 14.8% |