Serbian vs Immigrants from Kenya 6th Grade
COMPARE
Serbian
Immigrants from Kenya
6th Grade
6th Grade Comparison
Serbians
Immigrants from Kenya
97.7%
6TH GRADE
99.7/ 100
METRIC RATING
61st/ 347
METRIC RANK
97.0%
6TH GRADE
45.3/ 100
METRIC RATING
179th/ 347
METRIC RANK
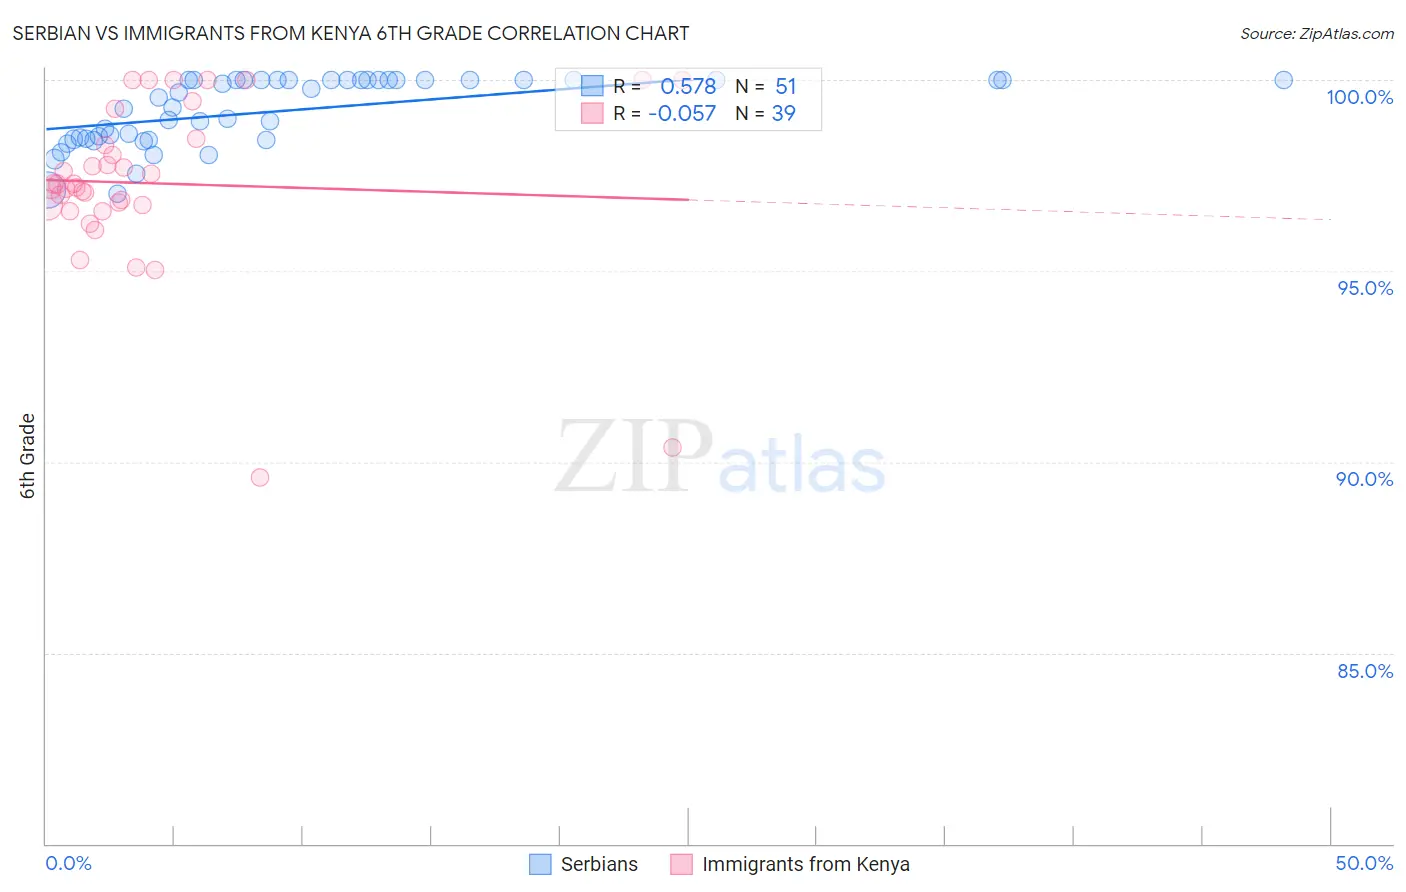
Serbian vs Immigrants from Kenya 6th Grade Correlation Chart
The statistical analysis conducted on geographies consisting of 267,642,942 people shows a substantial positive correlation between the proportion of Serbians and percentage of population with at least 6th grade education in the United States with a correlation coefficient (R) of 0.578 and weighted average of 97.7%. Similarly, the statistical analysis conducted on geographies consisting of 218,076,690 people shows a slight negative correlation between the proportion of Immigrants from Kenya and percentage of population with at least 6th grade education in the United States with a correlation coefficient (R) of -0.057 and weighted average of 97.0%, a difference of 0.70%.
6th Grade Correlation Summary
| Measurement | Serbian | Immigrants from Kenya |
| Minimum | 97.0% | 89.6% |
| Maximum | 100.0% | 100.0% |
| Range | 3.0% | 10.4% |
| Mean | 99.2% | 97.3% |
| Median | 99.5% | 97.3% |
| Interquartile 25% (IQ1) | 98.4% | 96.7% |
| Interquartile 75% (IQ3) | 100.0% | 98.5% |
| Interquartile Range (IQR) | 1.6% | 1.7% |
| Standard Deviation (Sample) | 0.88% | 2.2% |
| Standard Deviation (Population) | 0.87% | 2.2% |
Similar Demographics by 6th Grade
Demographics Similar to Serbians by 6th Grade
In terms of 6th grade, the demographic groups most similar to Serbians are Immigrants from Canada (97.7%, a difference of 0.0%), American (97.7%, a difference of 0.010%), Immigrants from North America (97.7%, a difference of 0.010%), White/Caucasian (97.7%, a difference of 0.020%), and Greek (97.7%, a difference of 0.020%).
| Demographics | Rating | Rank | 6th Grade |
| Creek | 99.8 /100 | #54 | Exceptional 97.7% |
| Aleuts | 99.8 /100 | #55 | Exceptional 97.7% |
| Austrians | 99.8 /100 | #56 | Exceptional 97.7% |
| Whites/Caucasians | 99.8 /100 | #57 | Exceptional 97.7% |
| Greeks | 99.8 /100 | #58 | Exceptional 97.7% |
| Americans | 99.8 /100 | #59 | Exceptional 97.7% |
| Immigrants | Canada | 99.8 /100 | #60 | Exceptional 97.7% |
| Serbians | 99.7 /100 | #61 | Exceptional 97.7% |
| Immigrants | North America | 99.7 /100 | #62 | Exceptional 97.7% |
| Russians | 99.7 /100 | #63 | Exceptional 97.7% |
| Canadians | 99.7 /100 | #64 | Exceptional 97.7% |
| Immigrants | Northern Europe | 99.6 /100 | #65 | Exceptional 97.7% |
| New Zealanders | 99.6 /100 | #66 | Exceptional 97.7% |
| Kiowa | 99.6 /100 | #67 | Exceptional 97.7% |
| Immigrants | Austria | 99.6 /100 | #68 | Exceptional 97.7% |
Demographics Similar to Immigrants from Kenya by 6th Grade
In terms of 6th grade, the demographic groups most similar to Immigrants from Kenya are Pakistani (97.0%, a difference of 0.0%), Immigrants from Kazakhstan (97.0%, a difference of 0.010%), Immigrants from Micronesia (97.0%, a difference of 0.010%), Mongolian (97.0%, a difference of 0.010%), and Arab (97.0%, a difference of 0.020%).
| Demographics | Rating | Rank | 6th Grade |
| Egyptians | 50.9 /100 | #172 | Average 97.1% |
| Arabs | 50.1 /100 | #173 | Average 97.0% |
| Venezuelans | 50.0 /100 | #174 | Average 97.0% |
| Immigrants | Kazakhstan | 47.3 /100 | #175 | Average 97.0% |
| Immigrants | Micronesia | 47.1 /100 | #176 | Average 97.0% |
| Mongolians | 46.7 /100 | #177 | Average 97.0% |
| Pakistanis | 46.0 /100 | #178 | Average 97.0% |
| Immigrants | Kenya | 45.3 /100 | #179 | Average 97.0% |
| Immigrants | Spain | 39.9 /100 | #180 | Fair 97.0% |
| Comanche | 37.9 /100 | #181 | Fair 97.0% |
| Immigrants | Ukraine | 35.6 /100 | #182 | Fair 97.0% |
| Immigrants | Venezuela | 34.5 /100 | #183 | Fair 97.0% |
| Spanish Americans | 33.5 /100 | #184 | Fair 97.0% |
| Argentineans | 33.0 /100 | #185 | Fair 97.0% |
| Immigrants | Egypt | 31.4 /100 | #186 | Fair 97.0% |