Immigrants from Guatemala vs Immigrants from Colombia 8th Grade
COMPARE
Immigrants from Guatemala
Immigrants from Colombia
8th Grade
8th Grade Comparison
Immigrants from Guatemala
Immigrants from Colombia
90.7%
8TH GRADE
0.0/ 100
METRIC RATING
343rd/ 347
METRIC RANK
94.7%
8TH GRADE
0.2/ 100
METRIC RATING
275th/ 347
METRIC RANK
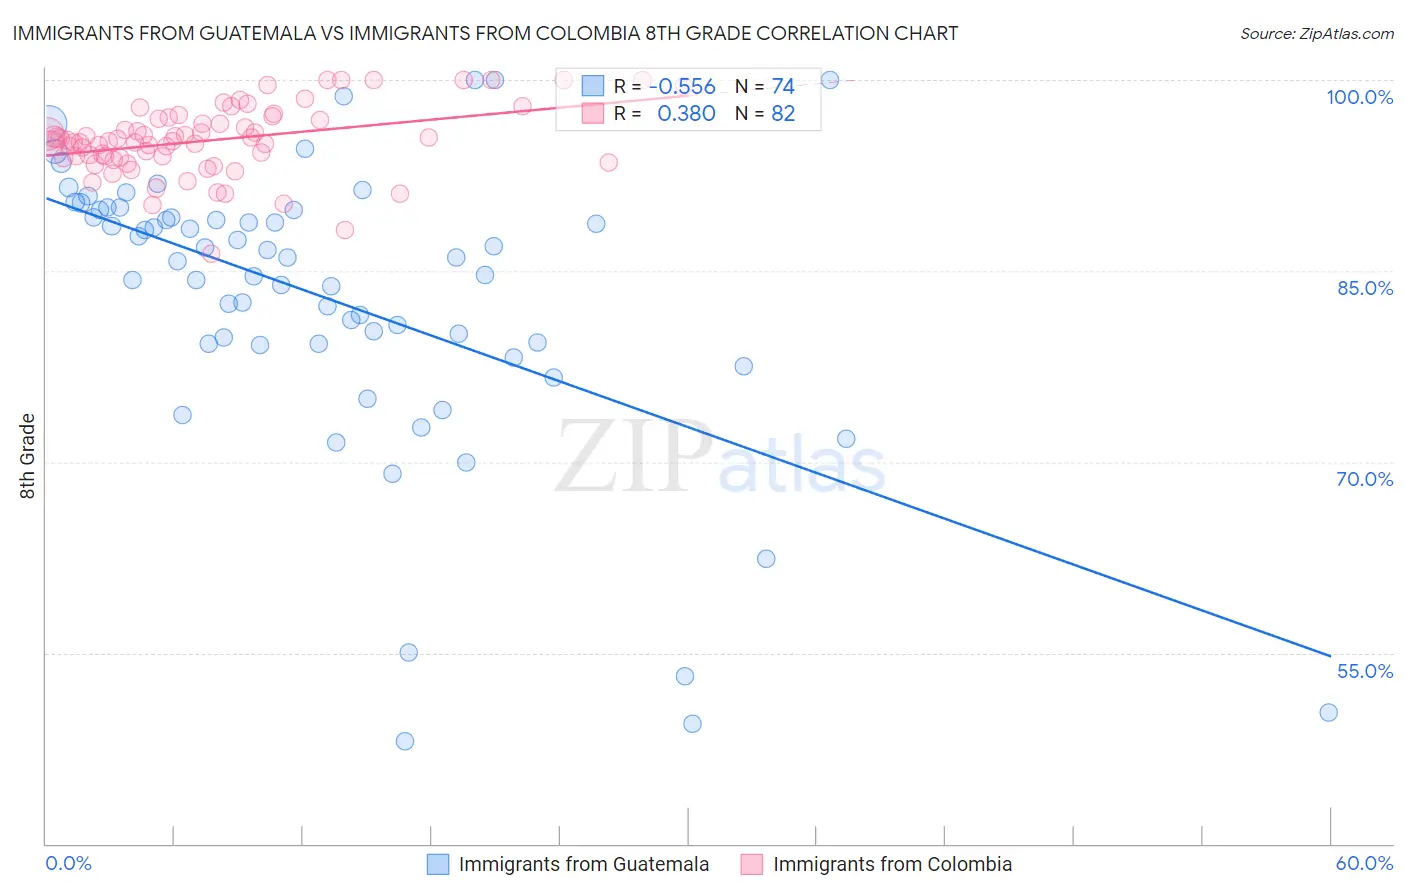
Immigrants from Guatemala vs Immigrants from Colombia 8th Grade Correlation Chart
The statistical analysis conducted on geographies consisting of 377,286,142 people shows a substantial negative correlation between the proportion of Immigrants from Guatemala and percentage of population with at least 8th grade education in the United States with a correlation coefficient (R) of -0.556 and weighted average of 90.7%. Similarly, the statistical analysis conducted on geographies consisting of 378,598,469 people shows a mild positive correlation between the proportion of Immigrants from Colombia and percentage of population with at least 8th grade education in the United States with a correlation coefficient (R) of 0.380 and weighted average of 94.7%, a difference of 4.4%.
8th Grade Correlation Summary
| Measurement | Immigrants from Guatemala | Immigrants from Colombia |
| Minimum | 48.1% | 86.4% |
| Maximum | 100.0% | 100.0% |
| Range | 51.9% | 13.6% |
| Mean | 82.8% | 95.3% |
| Median | 85.9% | 95.3% |
| Interquartile 25% (IQ1) | 79.2% | 93.9% |
| Interquartile 75% (IQ3) | 89.8% | 96.9% |
| Interquartile Range (IQR) | 10.5% | 3.0% |
| Standard Deviation (Sample) | 11.4% | 2.7% |
| Standard Deviation (Population) | 11.3% | 2.7% |
Similar Demographics by 8th Grade
Demographics Similar to Immigrants from Guatemala by 8th Grade
In terms of 8th grade, the demographic groups most similar to Immigrants from Guatemala are Salvadoran (90.9%, a difference of 0.17%), Immigrants from Central America (90.4%, a difference of 0.37%), Guatemalan (91.1%, a difference of 0.46%), Immigrants from El Salvador (90.3%, a difference of 0.46%), and Yakama (91.2%, a difference of 0.57%).
| Demographics | Rating | Rank | 8th Grade |
| Hispanics or Latinos | 0.0 /100 | #333 | Tragic 92.2% |
| Immigrants | Yemen | 0.0 /100 | #334 | Tragic 92.1% |
| Mexican American Indians | 0.0 /100 | #335 | Tragic 92.1% |
| Immigrants | Honduras | 0.0 /100 | #336 | Tragic 91.9% |
| Immigrants | Latin America | 0.0 /100 | #337 | Tragic 91.7% |
| Central Americans | 0.0 /100 | #338 | Tragic 91.6% |
| Mexicans | 0.0 /100 | #339 | Tragic 91.4% |
| Yakama | 0.0 /100 | #340 | Tragic 91.2% |
| Guatemalans | 0.0 /100 | #341 | Tragic 91.1% |
| Salvadorans | 0.0 /100 | #342 | Tragic 90.9% |
| Immigrants | Guatemala | 0.0 /100 | #343 | Tragic 90.7% |
| Immigrants | Central America | 0.0 /100 | #344 | Tragic 90.4% |
| Immigrants | El Salvador | 0.0 /100 | #345 | Tragic 90.3% |
| Immigrants | Mexico | 0.0 /100 | #346 | Tragic 90.2% |
| Spanish American Indians | 0.0 /100 | #347 | Tragic 89.8% |
Demographics Similar to Immigrants from Colombia by 8th Grade
In terms of 8th grade, the demographic groups most similar to Immigrants from Colombia are Trinidadian and Tobagonian (94.7%, a difference of 0.010%), Immigrants from Western Africa (94.8%, a difference of 0.020%), Immigrants from South America (94.8%, a difference of 0.030%), Peruvian (94.7%, a difference of 0.030%), and Immigrants from Uzbekistan (94.8%, a difference of 0.040%).
| Demographics | Rating | Rank | 8th Grade |
| Immigrants | Uruguay | 0.3 /100 | #268 | Tragic 94.8% |
| Immigrants | Thailand | 0.2 /100 | #269 | Tragic 94.8% |
| Immigrants | Uzbekistan | 0.2 /100 | #270 | Tragic 94.8% |
| Immigrants | Afghanistan | 0.2 /100 | #271 | Tragic 94.8% |
| Immigrants | South America | 0.2 /100 | #272 | Tragic 94.8% |
| Immigrants | Western Africa | 0.2 /100 | #273 | Tragic 94.8% |
| Trinidadians and Tobagonians | 0.2 /100 | #274 | Tragic 94.7% |
| Immigrants | Colombia | 0.2 /100 | #275 | Tragic 94.7% |
| Peruvians | 0.1 /100 | #276 | Tragic 94.7% |
| Taiwanese | 0.1 /100 | #277 | Tragic 94.7% |
| Armenians | 0.1 /100 | #278 | Tragic 94.7% |
| Immigrants | Trinidad and Tobago | 0.1 /100 | #279 | Tragic 94.6% |
| Barbadians | 0.1 /100 | #280 | Tragic 94.6% |
| Immigrants | Bolivia | 0.1 /100 | #281 | Tragic 94.6% |
| Immigrants | Eritrea | 0.1 /100 | #282 | Tragic 94.6% |