Immigrants from Singapore vs Egyptian 4th Grade
COMPARE
Immigrants from Singapore
Egyptian
4th Grade
4th Grade Comparison
Immigrants from Singapore
Egyptians
97.9%
4TH GRADE
97.3/ 100
METRIC RATING
108th/ 347
METRIC RANK
97.5%
4TH GRADE
50.0/ 100
METRIC RATING
174th/ 347
METRIC RANK
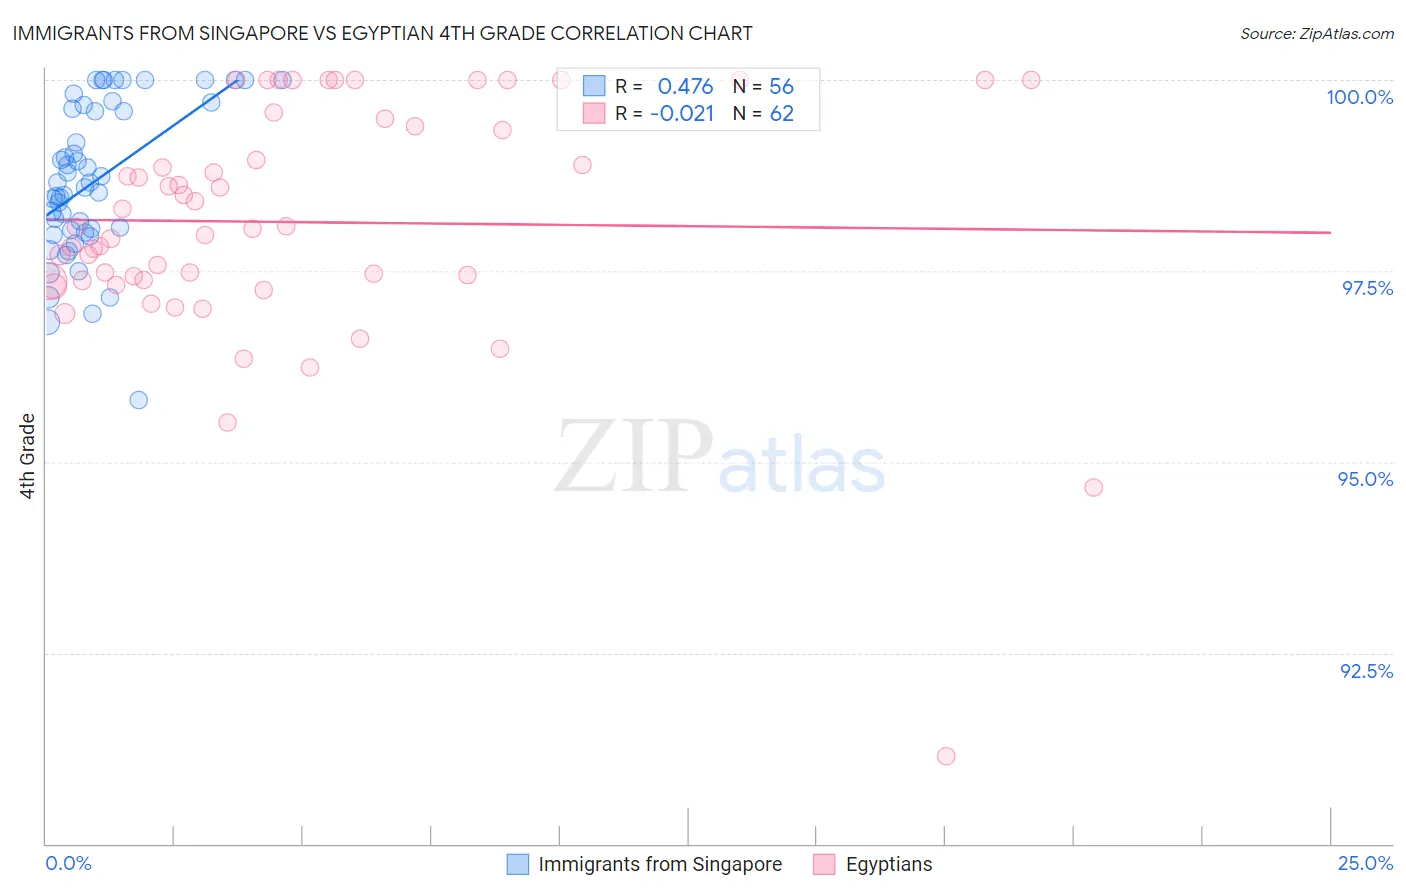
Immigrants from Singapore vs Egyptian 4th Grade Correlation Chart
The statistical analysis conducted on geographies consisting of 137,521,094 people shows a moderate positive correlation between the proportion of Immigrants from Singapore and percentage of population with at least 4th grade education in the United States with a correlation coefficient (R) of 0.476 and weighted average of 97.9%. Similarly, the statistical analysis conducted on geographies consisting of 276,927,423 people shows no correlation between the proportion of Egyptians and percentage of population with at least 4th grade education in the United States with a correlation coefficient (R) of -0.021 and weighted average of 97.5%, a difference of 0.34%.
4th Grade Correlation Summary
| Measurement | Immigrants from Singapore | Egyptian |
| Minimum | 95.8% | 91.1% |
| Maximum | 100.0% | 100.0% |
| Range | 4.2% | 8.9% |
| Mean | 98.7% | 98.1% |
| Median | 98.6% | 98.1% |
| Interquartile 25% (IQ1) | 98.0% | 97.4% |
| Interquartile 75% (IQ3) | 99.6% | 99.4% |
| Interquartile Range (IQR) | 1.6% | 2.0% |
| Standard Deviation (Sample) | 0.99% | 1.6% |
| Standard Deviation (Population) | 0.99% | 1.5% |
Similar Demographics by 4th Grade
Demographics Similar to Immigrants from Singapore by 4th Grade
In terms of 4th grade, the demographic groups most similar to Immigrants from Singapore are Bhutanese (97.9%, a difference of 0.0%), Puget Sound Salish (97.9%, a difference of 0.010%), Nonimmigrants (97.9%, a difference of 0.010%), German Russian (97.9%, a difference of 0.010%), and Immigrants from Czechoslovakia (97.9%, a difference of 0.010%).
| Demographics | Rating | Rank | 4th Grade |
| Cree | 98.1 /100 | #101 | Exceptional 97.9% |
| Choctaw | 97.9 /100 | #102 | Exceptional 97.9% |
| Puget Sound Salish | 97.7 /100 | #103 | Exceptional 97.9% |
| Immigrants | Nonimmigrants | 97.5 /100 | #104 | Exceptional 97.9% |
| German Russians | 97.5 /100 | #105 | Exceptional 97.9% |
| Immigrants | Czechoslovakia | 97.5 /100 | #106 | Exceptional 97.9% |
| Bhutanese | 97.4 /100 | #107 | Exceptional 97.9% |
| Immigrants | Singapore | 97.3 /100 | #108 | Exceptional 97.9% |
| Immigrants | Latvia | 96.8 /100 | #109 | Exceptional 97.8% |
| Thais | 96.7 /100 | #110 | Exceptional 97.8% |
| Immigrants | Switzerland | 96.1 /100 | #111 | Exceptional 97.8% |
| Okinawans | 96.0 /100 | #112 | Exceptional 97.8% |
| Basques | 95.8 /100 | #113 | Exceptional 97.8% |
| Iroquois | 95.4 /100 | #114 | Exceptional 97.8% |
| Lebanese | 95.4 /100 | #115 | Exceptional 97.8% |
Demographics Similar to Egyptians by 4th Grade
In terms of 4th grade, the demographic groups most similar to Egyptians are Immigrants from Sri Lanka (97.5%, a difference of 0.0%), Immigrants from Korea (97.5%, a difference of 0.0%), Immigrants from Micronesia (97.5%, a difference of 0.0%), Arab (97.5%, a difference of 0.0%), and Immigrants from Spain (97.5%, a difference of 0.010%).
| Demographics | Rating | Rank | 4th Grade |
| Immigrants | Poland | 55.9 /100 | #167 | Average 97.5% |
| Immigrants | Belarus | 55.8 /100 | #168 | Average 97.5% |
| Chileans | 54.4 /100 | #169 | Average 97.5% |
| Immigrants | Spain | 51.8 /100 | #170 | Average 97.5% |
| Brazilians | 51.5 /100 | #171 | Average 97.5% |
| Immigrants | Sri Lanka | 51.1 /100 | #172 | Average 97.5% |
| Immigrants | Korea | 50.6 /100 | #173 | Average 97.5% |
| Egyptians | 50.0 /100 | #174 | Average 97.5% |
| Immigrants | Micronesia | 49.6 /100 | #175 | Average 97.5% |
| Arabs | 48.7 /100 | #176 | Average 97.5% |
| Immigrants | Brazil | 46.1 /100 | #177 | Average 97.5% |
| Comanche | 45.3 /100 | #178 | Average 97.5% |
| Immigrants | Kazakhstan | 43.6 /100 | #179 | Average 97.5% |
| Immigrants | Venezuela | 42.7 /100 | #180 | Average 97.5% |
| Immigrants | Taiwan | 41.5 /100 | #181 | Average 97.5% |