Yup'ik vs Bangladeshi Cognitive Disability
COMPARE
Yup'ik
Bangladeshi
Cognitive Disability
Cognitive Disability Comparison
Yup'ik
Bangladeshis
16.9%
COGNITIVE DISABILITY
96.9/ 100
METRIC RATING
115th/ 347
METRIC RANK
18.6%
COGNITIVE DISABILITY
0.0/ 100
METRIC RATING
318th/ 347
METRIC RANK
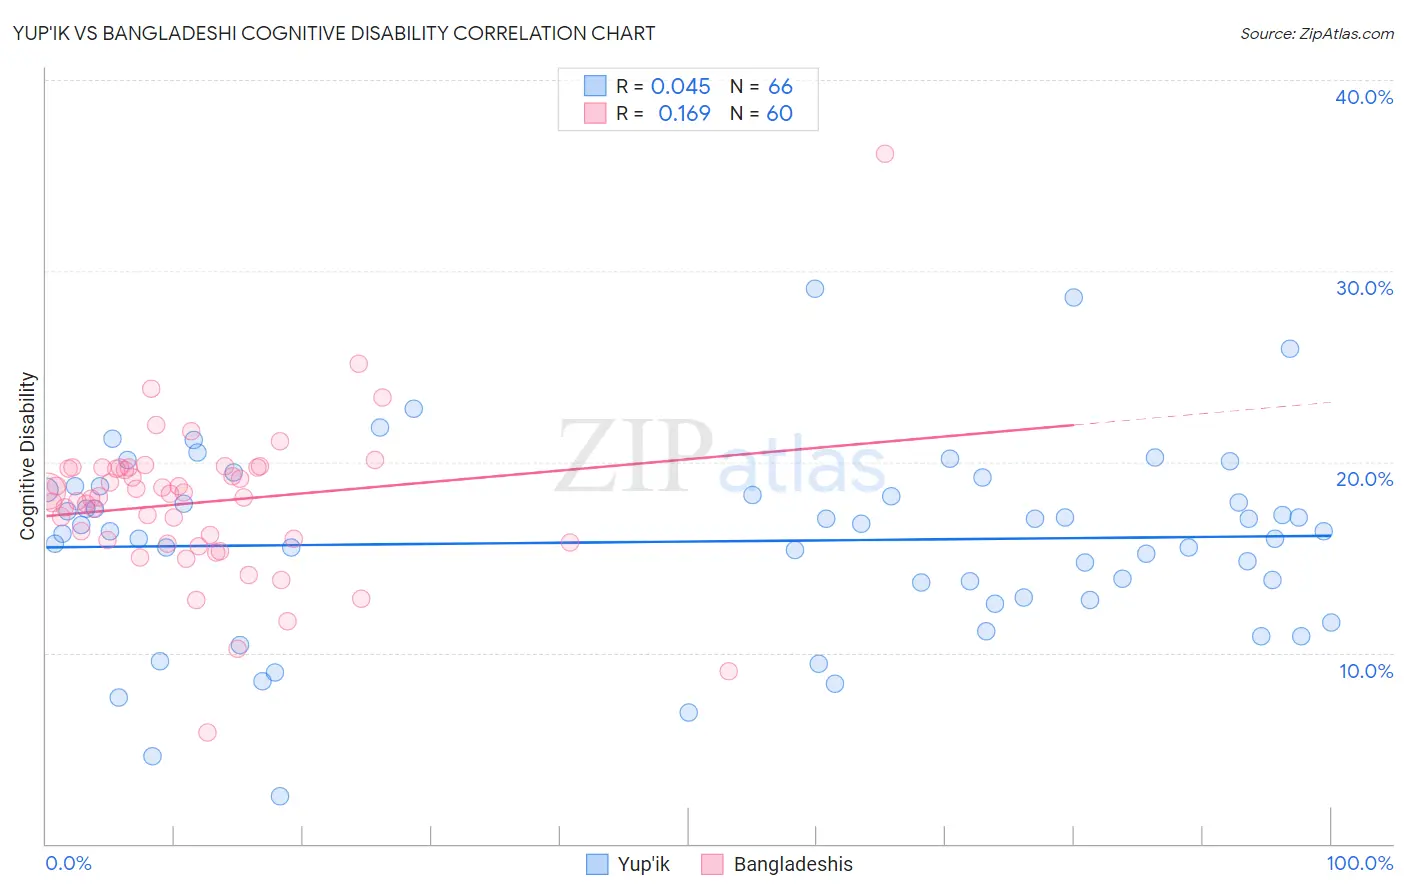
Yup'ik vs Bangladeshi Cognitive Disability Correlation Chart
The statistical analysis conducted on geographies consisting of 39,961,414 people shows no correlation between the proportion of Yup'ik and percentage of population with cognitive disability in the United States with a correlation coefficient (R) of 0.045 and weighted average of 16.9%. Similarly, the statistical analysis conducted on geographies consisting of 141,390,027 people shows a poor positive correlation between the proportion of Bangladeshis and percentage of population with cognitive disability in the United States with a correlation coefficient (R) of 0.169 and weighted average of 18.6%, a difference of 10.4%.
Cognitive Disability Correlation Summary
| Measurement | Yup'ik | Bangladeshi |
| Minimum | 2.5% | 5.8% |
| Maximum | 29.1% | 36.1% |
| Range | 26.6% | 30.3% |
| Mean | 15.8% | 17.9% |
| Median | 16.4% | 18.3% |
| Interquartile 25% (IQ1) | 12.9% | 15.9% |
| Interquartile 75% (IQ3) | 18.5% | 19.7% |
| Interquartile Range (IQR) | 5.7% | 3.8% |
| Standard Deviation (Sample) | 5.0% | 4.1% |
| Standard Deviation (Population) | 5.0% | 4.1% |
Similar Demographics by Cognitive Disability
Demographics Similar to Yup'ik by Cognitive Disability
In terms of cognitive disability, the demographic groups most similar to Yup'ik are Korean (16.8%, a difference of 0.050%), Indian (Asian) (16.8%, a difference of 0.060%), Immigrants from Sri Lanka (16.8%, a difference of 0.060%), Uruguayan (16.8%, a difference of 0.080%), and Arapaho (16.8%, a difference of 0.090%).
| Demographics | Rating | Rank | Cognitive Disability |
| Canadians | 97.5 /100 | #108 | Exceptional 16.8% |
| Albanians | 97.3 /100 | #109 | Exceptional 16.8% |
| Arapaho | 97.3 /100 | #110 | Exceptional 16.8% |
| Uruguayans | 97.2 /100 | #111 | Exceptional 16.8% |
| Indians (Asian) | 97.2 /100 | #112 | Exceptional 16.8% |
| Immigrants | Sri Lanka | 97.1 /100 | #113 | Exceptional 16.8% |
| Koreans | 97.1 /100 | #114 | Exceptional 16.8% |
| Yup'ik | 96.9 /100 | #115 | Exceptional 16.9% |
| Inupiat | 96.5 /100 | #116 | Exceptional 16.9% |
| Immigrants | Japan | 96.2 /100 | #117 | Exceptional 16.9% |
| Immigrants | Denmark | 96.2 /100 | #118 | Exceptional 16.9% |
| South Africans | 95.5 /100 | #119 | Exceptional 16.9% |
| Scottish | 95.0 /100 | #120 | Exceptional 16.9% |
| Immigrants | China | 94.9 /100 | #121 | Exceptional 16.9% |
| Immigrants | Western Europe | 94.8 /100 | #122 | Exceptional 16.9% |
Demographics Similar to Bangladeshis by Cognitive Disability
In terms of cognitive disability, the demographic groups most similar to Bangladeshis are Comanche (18.6%, a difference of 0.040%), Apache (18.6%, a difference of 0.080%), Liberian (18.6%, a difference of 0.12%), African (18.6%, a difference of 0.17%), and Immigrants from Middle Africa (18.6%, a difference of 0.20%).
| Demographics | Rating | Rank | Cognitive Disability |
| Hmong | 0.0 /100 | #311 | Tragic 18.4% |
| Chickasaw | 0.0 /100 | #312 | Tragic 18.5% |
| Yaqui | 0.0 /100 | #313 | Tragic 18.5% |
| Sub-Saharan Africans | 0.0 /100 | #314 | Tragic 18.5% |
| Immigrants | Dominica | 0.0 /100 | #315 | Tragic 18.6% |
| Immigrants | Middle Africa | 0.0 /100 | #316 | Tragic 18.6% |
| Liberians | 0.0 /100 | #317 | Tragic 18.6% |
| Bangladeshis | 0.0 /100 | #318 | Tragic 18.6% |
| Comanche | 0.0 /100 | #319 | Tragic 18.6% |
| Apache | 0.0 /100 | #320 | Tragic 18.6% |
| Africans | 0.0 /100 | #321 | Tragic 18.6% |
| Immigrants | Liberia | 0.0 /100 | #322 | Tragic 18.7% |
| Pueblo | 0.0 /100 | #323 | Tragic 18.7% |
| Dominicans | 0.0 /100 | #324 | Tragic 18.7% |
| Indonesians | 0.0 /100 | #325 | Tragic 18.7% |