Immigrants from Bangladesh vs Immigrants from South Eastern Asia Disability Age 65 to 74
COMPARE
Immigrants from Bangladesh
Immigrants from South Eastern Asia
Disability Age 65 to 74
Disability Age 65 to 74 Comparison
Immigrants from Bangladesh
Immigrants from South Eastern Asia
23.6%
DISABILITY AGE 65 TO 74
30.2/ 100
METRIC RATING
191st/ 347
METRIC RANK
23.3%
DISABILITY AGE 65 TO 74
50.0/ 100
METRIC RATING
174th/ 347
METRIC RANK
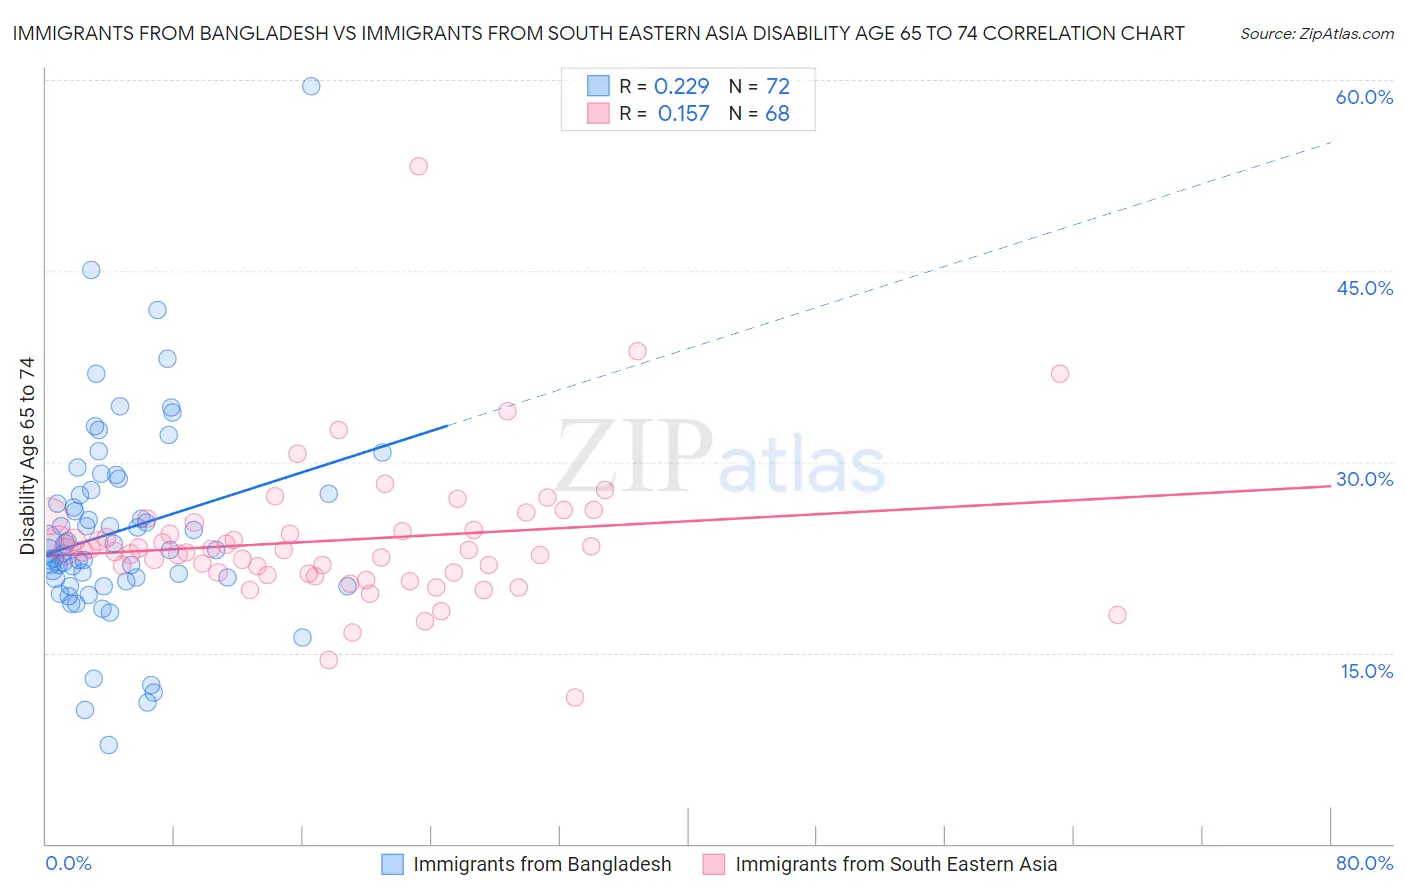
Immigrants from Bangladesh vs Immigrants from South Eastern Asia Disability Age 65 to 74 Correlation Chart
The statistical analysis conducted on geographies consisting of 203,421,949 people shows a weak positive correlation between the proportion of Immigrants from Bangladesh and percentage of population with a disability between the ages 65 and 75 in the United States with a correlation coefficient (R) of 0.229 and weighted average of 23.6%. Similarly, the statistical analysis conducted on geographies consisting of 511,151,711 people shows a poor positive correlation between the proportion of Immigrants from South Eastern Asia and percentage of population with a disability between the ages 65 and 75 in the United States with a correlation coefficient (R) of 0.157 and weighted average of 23.3%, a difference of 1.2%.
Disability Age 65 to 74 Correlation Summary
| Measurement | Immigrants from Bangladesh | Immigrants from South Eastern Asia |
| Minimum | 7.8% | 11.5% |
| Maximum | 59.5% | 53.2% |
| Range | 51.7% | 41.6% |
| Mean | 24.6% | 23.9% |
| Median | 23.1% | 23.0% |
| Interquartile 25% (IQ1) | 20.7% | 21.2% |
| Interquartile 75% (IQ3) | 27.7% | 25.0% |
| Interquartile Range (IQR) | 6.9% | 3.7% |
| Standard Deviation (Sample) | 8.0% | 5.7% |
| Standard Deviation (Population) | 7.9% | 5.6% |
Demographics Similar to Immigrants from Bangladesh and Immigrants from South Eastern Asia by Disability Age 65 to 74
In terms of disability age 65 to 74, the demographic groups most similar to Immigrants from Bangladesh are Ecuadorian (23.6%, a difference of 0.030%), Immigrants from Guyana (23.6%, a difference of 0.070%), Scottish (23.6%, a difference of 0.19%), Immigrants from Cuba (23.6%, a difference of 0.25%), and Portuguese (23.5%, a difference of 0.49%). Similarly, the demographic groups most similar to Immigrants from South Eastern Asia are Yugoslavian (23.3%, a difference of 0.010%), German (23.3%, a difference of 0.030%), Dutch (23.3%, a difference of 0.040%), Immigrants from Eritrea (23.4%, a difference of 0.14%), and Immigrants from Haiti (23.4%, a difference of 0.14%).
| Demographics | Rating | Rank | Disability Age 65 to 74 |
| Germans | 50.5 /100 | #172 | Average 23.3% |
| Yugoslavians | 50.2 /100 | #173 | Average 23.3% |
| Immigrants | South Eastern Asia | 50.0 /100 | #174 | Average 23.3% |
| Dutch | 49.4 /100 | #175 | Average 23.3% |
| Immigrants | Eritrea | 47.5 /100 | #176 | Average 23.4% |
| Immigrants | Haiti | 47.5 /100 | #177 | Average 23.4% |
| Guyanese | 45.8 /100 | #178 | Average 23.4% |
| Immigrants | Sierra Leone | 45.8 /100 | #179 | Average 23.4% |
| Scandinavians | 45.6 /100 | #180 | Average 23.4% |
| Assyrians/Chaldeans/Syriacs | 45.3 /100 | #181 | Average 23.4% |
| Irish | 44.4 /100 | #182 | Average 23.4% |
| Immigrants | Eastern Africa | 42.8 /100 | #183 | Average 23.4% |
| Immigrants | Germany | 42.5 /100 | #184 | Average 23.4% |
| Haitians | 42.4 /100 | #185 | Average 23.4% |
| Basques | 38.4 /100 | #186 | Fair 23.5% |
| Portuguese | 37.8 /100 | #187 | Fair 23.5% |
| Immigrants | Cuba | 34.0 /100 | #188 | Fair 23.6% |
| Scottish | 33.1 /100 | #189 | Fair 23.6% |
| Immigrants | Guyana | 31.2 /100 | #190 | Fair 23.6% |
| Immigrants | Bangladesh | 30.2 /100 | #191 | Fair 23.6% |
| Ecuadorians | 29.7 /100 | #192 | Fair 23.6% |