Hmong vs Comanche Disability Age 65 to 74
COMPARE
Hmong
Comanche
Disability Age 65 to 74
Disability Age 65 to 74 Comparison
Hmong
Comanche
25.7%
DISABILITY AGE 65 TO 74
0.1/ 100
METRIC RATING
269th/ 347
METRIC RANK
28.3%
DISABILITY AGE 65 TO 74
0.0/ 100
METRIC RATING
321st/ 347
METRIC RANK
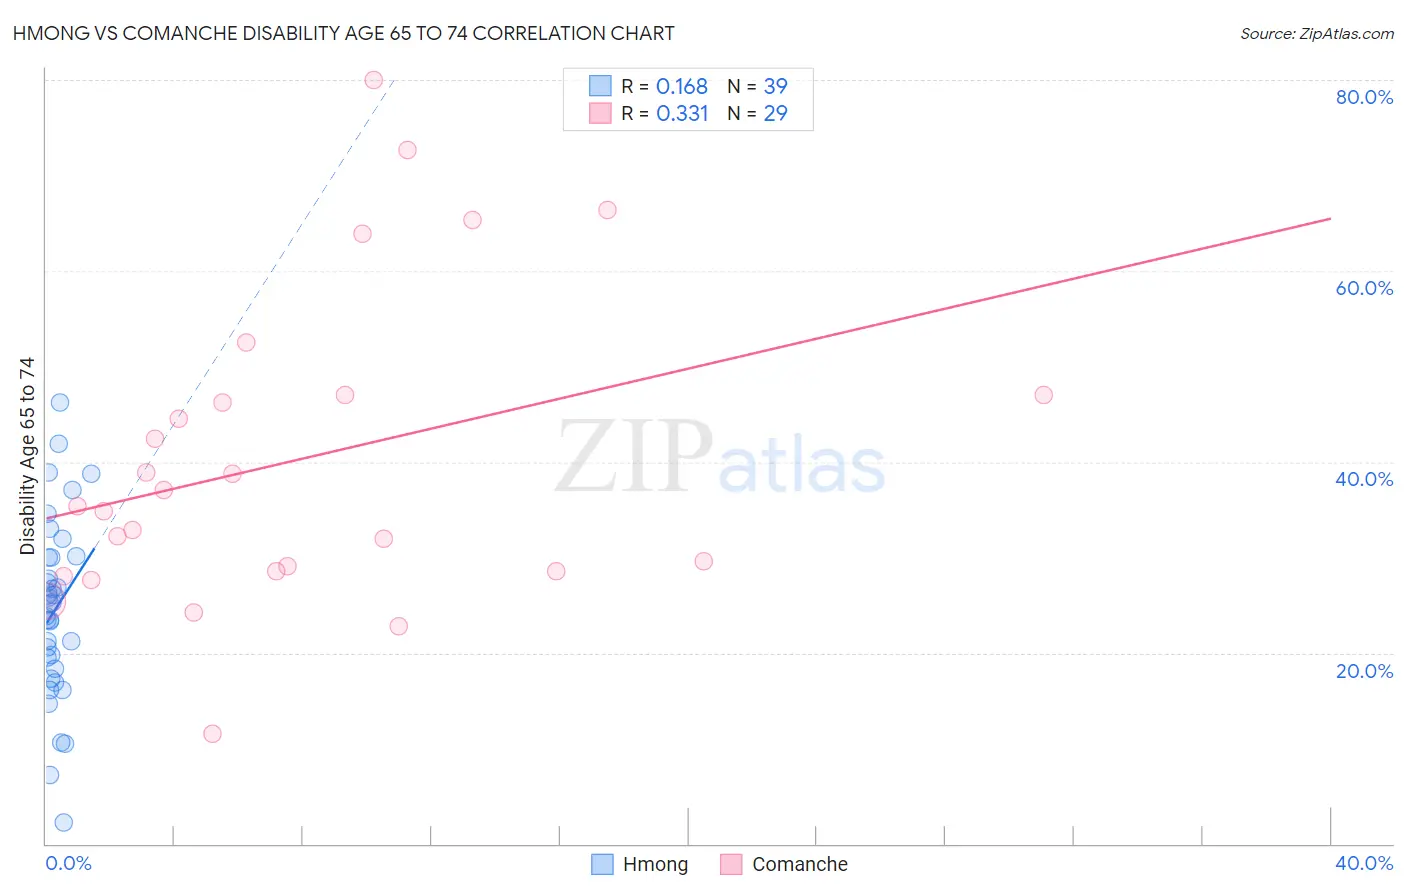
Hmong vs Comanche Disability Age 65 to 74 Correlation Chart
The statistical analysis conducted on geographies consisting of 24,678,157 people shows a poor positive correlation between the proportion of Hmong and percentage of population with a disability between the ages 65 and 75 in the United States with a correlation coefficient (R) of 0.168 and weighted average of 25.7%. Similarly, the statistical analysis conducted on geographies consisting of 109,698,765 people shows a mild positive correlation between the proportion of Comanche and percentage of population with a disability between the ages 65 and 75 in the United States with a correlation coefficient (R) of 0.331 and weighted average of 28.3%, a difference of 10.4%.
Disability Age 65 to 74 Correlation Summary
| Measurement | Hmong | Comanche |
| Minimum | 2.3% | 11.6% |
| Maximum | 46.3% | 80.0% |
| Range | 44.0% | 68.4% |
| Mean | 24.5% | 40.2% |
| Median | 25.1% | 35.3% |
| Interquartile 25% (IQ1) | 18.3% | 28.6% |
| Interquartile 75% (IQ3) | 30.0% | 47.1% |
| Interquartile Range (IQR) | 11.6% | 18.5% |
| Standard Deviation (Sample) | 9.4% | 16.3% |
| Standard Deviation (Population) | 9.3% | 16.1% |
Similar Demographics by Disability Age 65 to 74
Demographics Similar to Hmong by Disability Age 65 to 74
In terms of disability age 65 to 74, the demographic groups most similar to Hmong are Immigrants from Guatemala (25.7%, a difference of 0.080%), Immigrants from Liberia (25.7%, a difference of 0.11%), Immigrants from Dominica (25.7%, a difference of 0.11%), Liberian (25.6%, a difference of 0.12%), and Ottawa (25.6%, a difference of 0.22%).
| Demographics | Rating | Rank | Disability Age 65 to 74 |
| Samoans | 0.2 /100 | #262 | Tragic 25.4% |
| Iroquois | 0.2 /100 | #263 | Tragic 25.4% |
| Hawaiians | 0.2 /100 | #264 | Tragic 25.5% |
| Guatemalans | 0.2 /100 | #265 | Tragic 25.5% |
| Immigrants | Latin America | 0.1 /100 | #266 | Tragic 25.6% |
| Ottawa | 0.1 /100 | #267 | Tragic 25.6% |
| Liberians | 0.1 /100 | #268 | Tragic 25.6% |
| Hmong | 0.1 /100 | #269 | Tragic 25.7% |
| Immigrants | Guatemala | 0.1 /100 | #270 | Tragic 25.7% |
| Immigrants | Liberia | 0.1 /100 | #271 | Tragic 25.7% |
| Immigrants | Dominica | 0.1 /100 | #272 | Tragic 25.7% |
| Japanese | 0.1 /100 | #273 | Tragic 25.7% |
| Americans | 0.1 /100 | #274 | Tragic 25.8% |
| Hondurans | 0.1 /100 | #275 | Tragic 25.8% |
| French American Indians | 0.1 /100 | #276 | Tragic 25.8% |
Demographics Similar to Comanche by Disability Age 65 to 74
In terms of disability age 65 to 74, the demographic groups most similar to Comanche are Aleut (28.4%, a difference of 0.33%), Cherokee (28.2%, a difference of 0.51%), Arapaho (28.1%, a difference of 0.89%), Nepalese (28.0%, a difference of 1.1%), and Immigrants from Armenia (28.0%, a difference of 1.3%).
| Demographics | Rating | Rank | Disability Age 65 to 74 |
| Chippewa | 0.0 /100 | #314 | Tragic 27.8% |
| Cajuns | 0.0 /100 | #315 | Tragic 27.9% |
| Crow | 0.0 /100 | #316 | Tragic 27.9% |
| Immigrants | Armenia | 0.0 /100 | #317 | Tragic 28.0% |
| Nepalese | 0.0 /100 | #318 | Tragic 28.0% |
| Arapaho | 0.0 /100 | #319 | Tragic 28.1% |
| Cherokee | 0.0 /100 | #320 | Tragic 28.2% |
| Comanche | 0.0 /100 | #321 | Tragic 28.3% |
| Aleuts | 0.0 /100 | #322 | Tragic 28.4% |
| Puerto Ricans | 0.0 /100 | #323 | Tragic 29.1% |
| Seminole | 0.0 /100 | #324 | Tragic 29.4% |
| Dutch West Indians | 0.0 /100 | #325 | Tragic 29.6% |
| Yakama | 0.0 /100 | #326 | Tragic 29.6% |
| Apache | 0.0 /100 | #327 | Tragic 29.7% |
| Hopi | 0.0 /100 | #328 | Tragic 30.0% |