Italian vs Immigrants from South Eastern Asia Disability Age 35 to 64
COMPARE
Italian
Immigrants from South Eastern Asia
Disability Age 35 to 64
Disability Age 35 to 64 Comparison
Italians
Immigrants from South Eastern Asia
11.2%
DISABILITY AGE 35 TO 64
55.6/ 100
METRIC RATING
172nd/ 347
METRIC RANK
10.6%
DISABILITY AGE 35 TO 64
95.7/ 100
METRIC RATING
117th/ 347
METRIC RANK
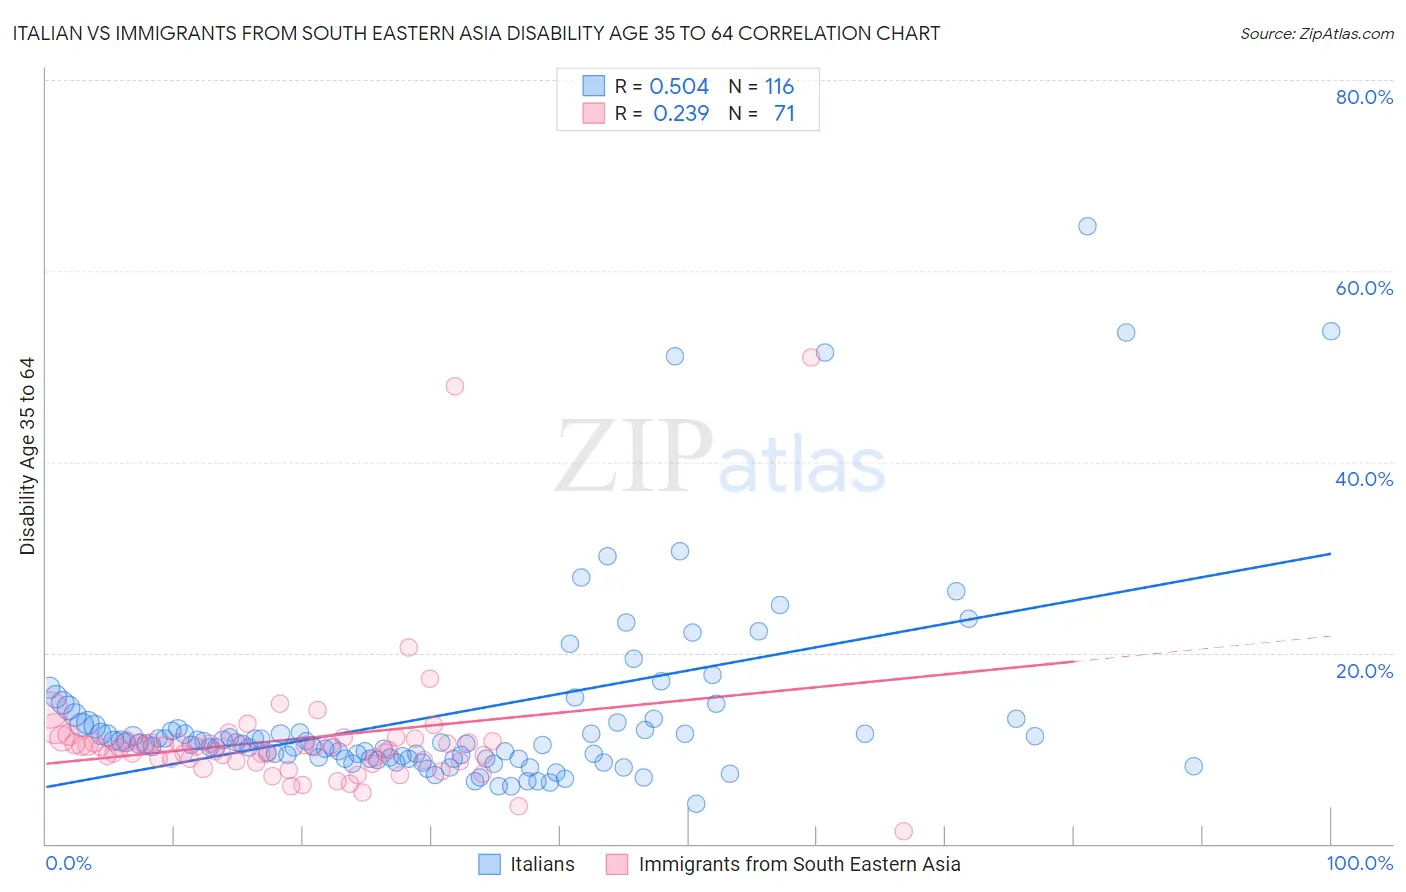
Italian vs Immigrants from South Eastern Asia Disability Age 35 to 64 Correlation Chart
The statistical analysis conducted on geographies consisting of 573,871,626 people shows a substantial positive correlation between the proportion of Italians and percentage of population with a disability between the ages 34 and 64 in the United States with a correlation coefficient (R) of 0.504 and weighted average of 11.2%. Similarly, the statistical analysis conducted on geographies consisting of 512,104,906 people shows a weak positive correlation between the proportion of Immigrants from South Eastern Asia and percentage of population with a disability between the ages 34 and 64 in the United States with a correlation coefficient (R) of 0.239 and weighted average of 10.6%, a difference of 6.2%.
Disability Age 35 to 64 Correlation Summary
| Measurement | Italian | Immigrants from South Eastern Asia |
| Minimum | 4.2% | 1.3% |
| Maximum | 64.6% | 50.9% |
| Range | 60.5% | 49.6% |
| Mean | 13.5% | 10.9% |
| Median | 10.5% | 10.1% |
| Interquartile 25% (IQ1) | 8.9% | 8.7% |
| Interquartile 75% (IQ3) | 12.6% | 10.7% |
| Interquartile Range (IQR) | 3.6% | 2.0% |
| Standard Deviation (Sample) | 10.1% | 7.1% |
| Standard Deviation (Population) | 10.1% | 7.1% |
Similar Demographics by Disability Age 35 to 64
Demographics Similar to Italians by Disability Age 35 to 64
In terms of disability age 35 to 64, the demographic groups most similar to Italians are Immigrants from Trinidad and Tobago (11.2%, a difference of 0.020%), Immigrants from Uganda (11.2%, a difference of 0.19%), Haitian (11.2%, a difference of 0.27%), Central American (11.2%, a difference of 0.29%), and Lebanese (11.3%, a difference of 0.31%).
| Demographics | Rating | Rank | Disability Age 35 to 64 |
| Immigrants | Western Europe | 65.2 /100 | #165 | Good 11.1% |
| Immigrants | Haiti | 63.8 /100 | #166 | Good 11.1% |
| Austrians | 63.2 /100 | #167 | Good 11.1% |
| Central Americans | 59.1 /100 | #168 | Average 11.2% |
| Haitians | 59.0 /100 | #169 | Average 11.2% |
| Immigrants | Uganda | 58.0 /100 | #170 | Average 11.2% |
| Immigrants | Trinidad and Tobago | 55.9 /100 | #171 | Average 11.2% |
| Italians | 55.6 /100 | #172 | Average 11.2% |
| Lebanese | 51.8 /100 | #173 | Average 11.3% |
| Immigrants | Fiji | 50.0 /100 | #174 | Average 11.3% |
| Czechs | 47.9 /100 | #175 | Average 11.3% |
| Ugandans | 43.7 /100 | #176 | Average 11.3% |
| Immigrants | Eastern Africa | 42.2 /100 | #177 | Average 11.3% |
| Poles | 42.0 /100 | #178 | Average 11.3% |
| Immigrants | Barbados | 41.6 /100 | #179 | Average 11.3% |
Demographics Similar to Immigrants from South Eastern Asia by Disability Age 35 to 64
In terms of disability age 35 to 64, the demographic groups most similar to Immigrants from South Eastern Asia are Immigrants from Moldova (10.6%, a difference of 0.090%), Immigrants from Nepal (10.6%, a difference of 0.10%), Luxembourger (10.6%, a difference of 0.14%), Vietnamese (10.6%, a difference of 0.16%), and Immigrants from Netherlands (10.5%, a difference of 0.33%).
| Demographics | Rating | Rank | Disability Age 35 to 64 |
| Koreans | 97.1 /100 | #110 | Exceptional 10.5% |
| Brazilians | 96.9 /100 | #111 | Exceptional 10.5% |
| Assyrians/Chaldeans/Syriacs | 96.8 /100 | #112 | Exceptional 10.5% |
| Tongans | 96.6 /100 | #113 | Exceptional 10.5% |
| Immigrants | Morocco | 96.6 /100 | #114 | Exceptional 10.5% |
| Immigrants | Netherlands | 96.3 /100 | #115 | Exceptional 10.5% |
| Immigrants | Nepal | 95.9 /100 | #116 | Exceptional 10.6% |
| Immigrants | South Eastern Asia | 95.7 /100 | #117 | Exceptional 10.6% |
| Immigrants | Moldova | 95.5 /100 | #118 | Exceptional 10.6% |
| Luxembourgers | 95.5 /100 | #119 | Exceptional 10.6% |
| Vietnamese | 95.4 /100 | #120 | Exceptional 10.6% |
| Romanians | 95.0 /100 | #121 | Exceptional 10.6% |
| Immigrants | Norway | 95.0 /100 | #122 | Exceptional 10.6% |
| Maltese | 94.8 /100 | #123 | Exceptional 10.6% |
| Estonians | 94.5 /100 | #124 | Exceptional 10.6% |