Vietnamese vs Immigrants from Uzbekistan Disability Age 65 to 74
COMPARE
Vietnamese
Immigrants from Uzbekistan
Disability Age 65 to 74
Disability Age 65 to 74 Comparison
Vietnamese
Immigrants from Uzbekistan
23.2%
DISABILITY AGE 65 TO 74
60.8/ 100
METRIC RATING
165th/ 347
METRIC RANK
22.8%
DISABILITY AGE 65 TO 74
83.1/ 100
METRIC RATING
147th/ 347
METRIC RANK
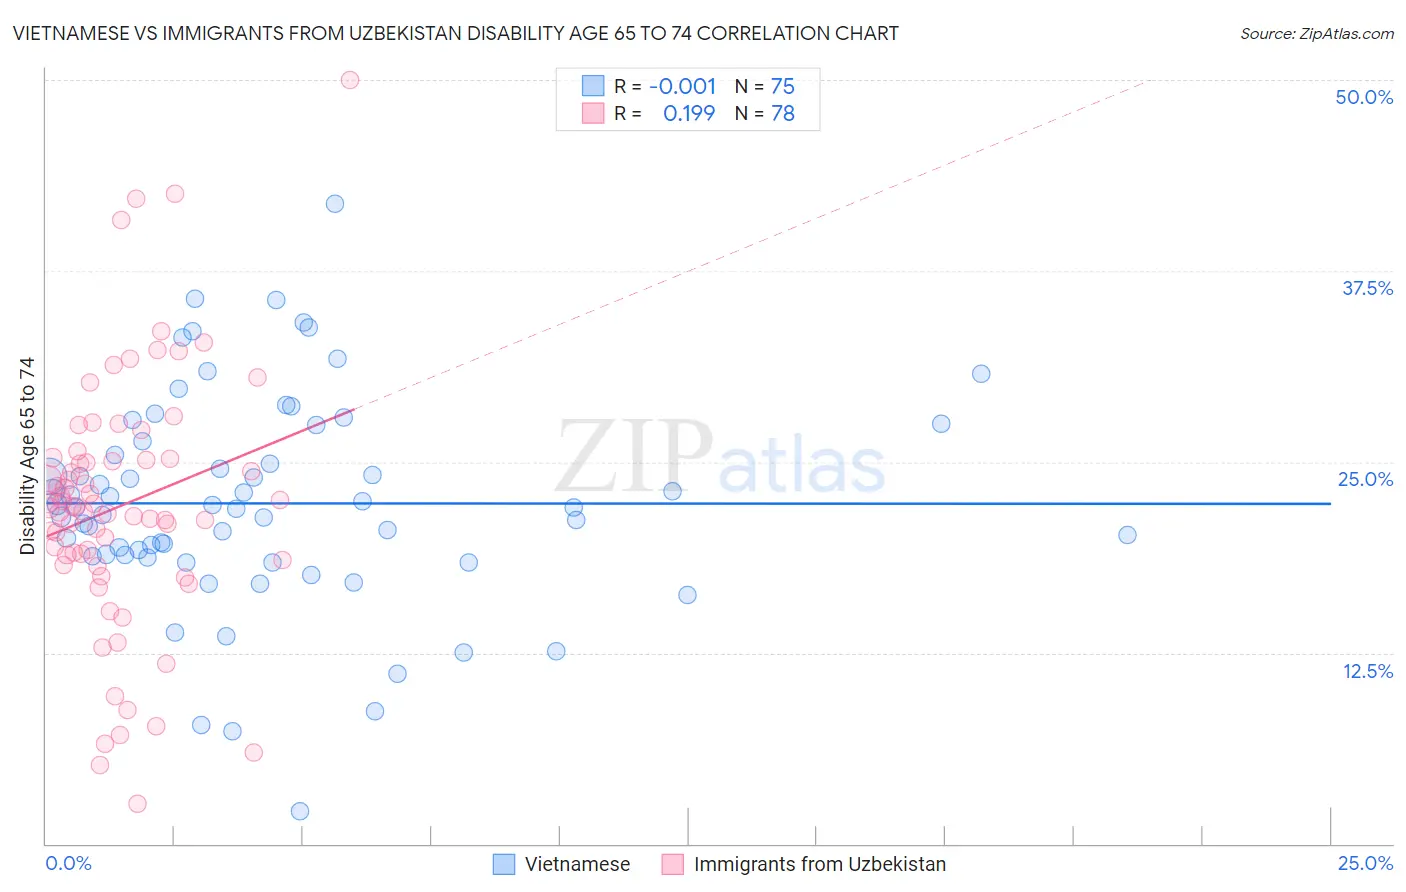
Vietnamese vs Immigrants from Uzbekistan Disability Age 65 to 74 Correlation Chart
The statistical analysis conducted on geographies consisting of 170,489,851 people shows no correlation between the proportion of Vietnamese and percentage of population with a disability between the ages 65 and 75 in the United States with a correlation coefficient (R) of -0.001 and weighted average of 23.2%. Similarly, the statistical analysis conducted on geographies consisting of 118,581,209 people shows a poor positive correlation between the proportion of Immigrants from Uzbekistan and percentage of population with a disability between the ages 65 and 75 in the United States with a correlation coefficient (R) of 0.199 and weighted average of 22.8%, a difference of 1.7%.
Disability Age 65 to 74 Correlation Summary
| Measurement | Vietnamese | Immigrants from Uzbekistan |
| Minimum | 2.1% | 2.6% |
| Maximum | 41.9% | 50.0% |
| Range | 39.8% | 47.4% |
| Mean | 22.3% | 22.1% |
| Median | 22.0% | 22.0% |
| Interquartile 25% (IQ1) | 18.8% | 18.6% |
| Interquartile 75% (IQ3) | 26.3% | 25.2% |
| Interquartile Range (IQR) | 7.5% | 6.6% |
| Standard Deviation (Sample) | 7.0% | 8.4% |
| Standard Deviation (Population) | 7.0% | 8.4% |
Demographics Similar to Vietnamese and Immigrants from Uzbekistan by Disability Age 65 to 74
In terms of disability age 65 to 74, the demographic groups most similar to Vietnamese are Sierra Leonean (23.2%, a difference of 0.010%), Immigrants from Philippines (23.2%, a difference of 0.020%), Immigrants from Afghanistan (23.2%, a difference of 0.020%), European (23.2%, a difference of 0.030%), and Immigrants from Cameroon (23.1%, a difference of 0.19%). Similarly, the demographic groups most similar to Immigrants from Uzbekistan are Alsatian (22.8%, a difference of 0.070%), New Zealander (22.9%, a difference of 0.32%), Swiss (22.9%, a difference of 0.34%), Canadian (22.9%, a difference of 0.51%), and Immigrants from Morocco (22.9%, a difference of 0.52%).
| Demographics | Rating | Rank | Disability Age 65 to 74 |
| Alsatians | 83.7 /100 | #146 | Excellent 22.8% |
| Immigrants | Uzbekistan | 83.1 /100 | #147 | Excellent 22.8% |
| New Zealanders | 79.9 /100 | #148 | Good 22.9% |
| Swiss | 79.7 /100 | #149 | Good 22.9% |
| Canadians | 77.7 /100 | #150 | Good 22.9% |
| Immigrants | Morocco | 77.6 /100 | #151 | Good 22.9% |
| Finns | 76.5 /100 | #152 | Good 22.9% |
| Slavs | 75.2 /100 | #153 | Good 23.0% |
| Sri Lankans | 74.0 /100 | #154 | Good 23.0% |
| British | 73.9 /100 | #155 | Good 23.0% |
| Immigrants | Western Asia | 73.8 /100 | #156 | Good 23.0% |
| Czechoslovakians | 72.4 /100 | #157 | Good 23.0% |
| Immigrants | Vietnam | 69.1 /100 | #158 | Good 23.1% |
| South American Indians | 65.5 /100 | #159 | Good 23.1% |
| Koreans | 64.2 /100 | #160 | Good 23.1% |
| Immigrants | Cameroon | 63.8 /100 | #161 | Good 23.1% |
| Europeans | 61.2 /100 | #162 | Good 23.2% |
| Immigrants | Philippines | 61.1 /100 | #163 | Good 23.2% |
| Sierra Leoneans | 60.9 /100 | #164 | Good 23.2% |
| Vietnamese | 60.8 /100 | #165 | Good 23.2% |
| Immigrants | Afghanistan | 60.5 /100 | #166 | Good 23.2% |