Uruguayan vs Immigrants from Sweden Disability Age 18 to 34
COMPARE
Uruguayan
Immigrants from Sweden
Disability Age 18 to 34
Disability Age 18 to 34 Comparison
Uruguayans
Immigrants from Sweden
6.2%
DISABILITY AGE 18 TO 34
97.3/ 100
METRIC RATING
97th/ 347
METRIC RANK
6.4%
DISABILITY AGE 18 TO 34
88.5/ 100
METRIC RATING
136th/ 347
METRIC RANK
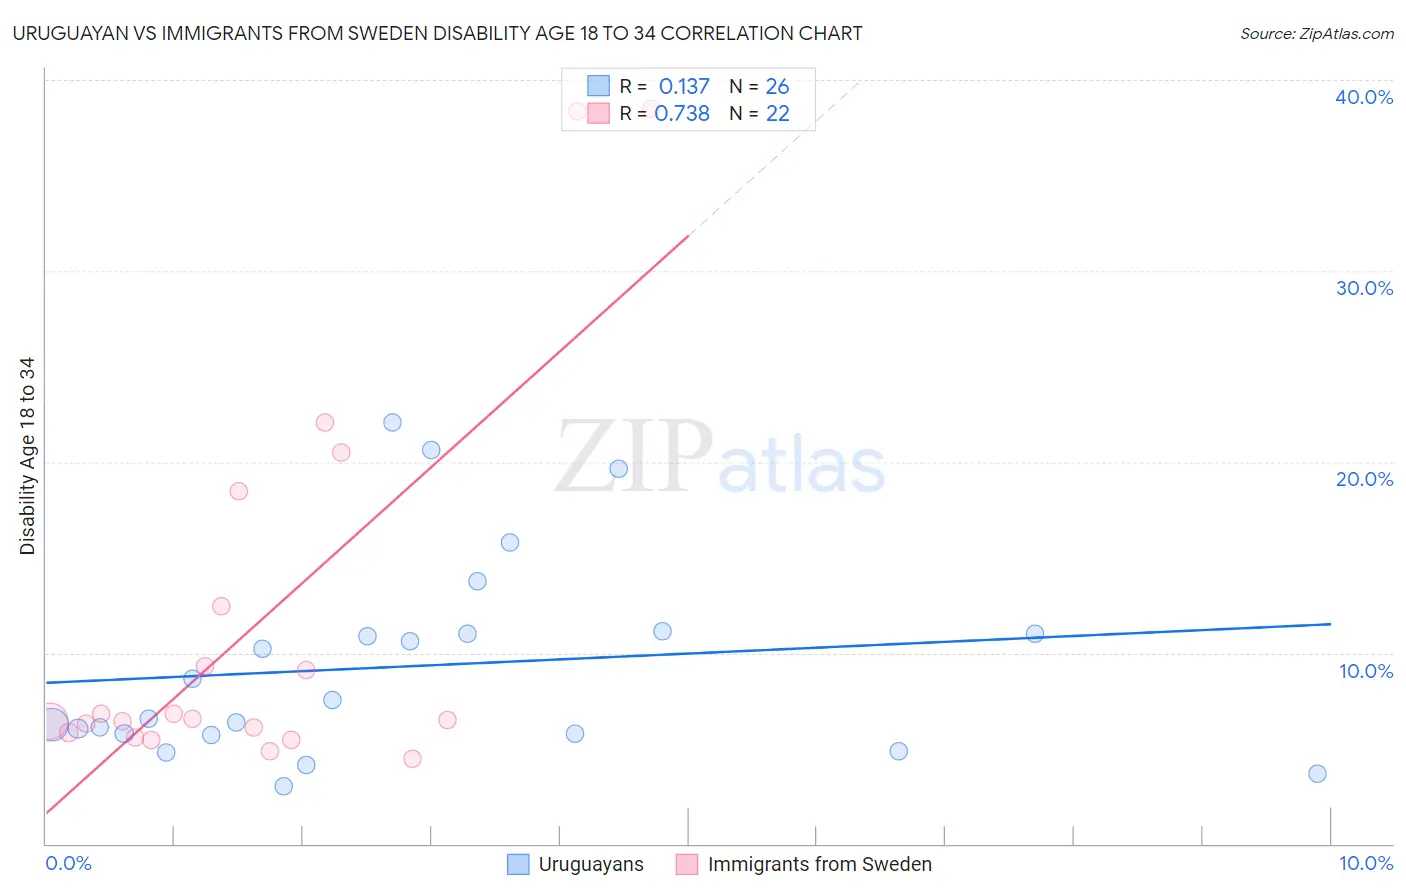
Uruguayan vs Immigrants from Sweden Disability Age 18 to 34 Correlation Chart
The statistical analysis conducted on geographies consisting of 144,733,495 people shows a poor positive correlation between the proportion of Uruguayans and percentage of population with a disability between the ages 18 and 35 in the United States with a correlation coefficient (R) of 0.137 and weighted average of 6.2%. Similarly, the statistical analysis conducted on geographies consisting of 164,544,518 people shows a strong positive correlation between the proportion of Immigrants from Sweden and percentage of population with a disability between the ages 18 and 35 in the United States with a correlation coefficient (R) of 0.738 and weighted average of 6.4%, a difference of 2.8%.
Disability Age 18 to 34 Correlation Summary
| Measurement | Uruguayan | Immigrants from Sweden |
| Minimum | 3.0% | 4.5% |
| Maximum | 22.1% | 38.5% |
| Range | 19.0% | 34.0% |
| Mean | 9.3% | 11.5% |
| Median | 7.0% | 6.5% |
| Interquartile 25% (IQ1) | 5.8% | 5.8% |
| Interquartile 75% (IQ3) | 11.0% | 12.4% |
| Interquartile Range (IQR) | 5.2% | 6.6% |
| Standard Deviation (Sample) | 5.3% | 10.1% |
| Standard Deviation (Population) | 5.2% | 9.9% |
Similar Demographics by Disability Age 18 to 34
Demographics Similar to Uruguayans by Disability Age 18 to 34
In terms of disability age 18 to 34, the demographic groups most similar to Uruguayans are Immigrants from Syria (6.2%, a difference of 0.040%), Immigrants from Uruguay (6.2%, a difference of 0.080%), Central American (6.2%, a difference of 0.13%), Immigrants from Kazakhstan (6.2%, a difference of 0.16%), and Immigrants (6.2%, a difference of 0.21%).
| Demographics | Rating | Rank | Disability Age 18 to 34 |
| Immigrants | Vietnam | 97.7 /100 | #90 | Exceptional 6.2% |
| Immigrants | Philippines | 97.6 /100 | #91 | Exceptional 6.2% |
| Jordanians | 97.6 /100 | #92 | Exceptional 6.2% |
| Immigrants | Immigrants | 97.6 /100 | #93 | Exceptional 6.2% |
| Immigrants | Kazakhstan | 97.5 /100 | #94 | Exceptional 6.2% |
| Central Americans | 97.5 /100 | #95 | Exceptional 6.2% |
| Immigrants | Uruguay | 97.4 /100 | #96 | Exceptional 6.2% |
| Uruguayans | 97.3 /100 | #97 | Exceptional 6.2% |
| Immigrants | Syria | 97.2 /100 | #98 | Exceptional 6.2% |
| Immigrants | Ethiopia | 96.9 /100 | #99 | Exceptional 6.2% |
| Immigrants | Albania | 96.7 /100 | #100 | Exceptional 6.2% |
| Immigrants | Jamaica | 96.4 /100 | #101 | Exceptional 6.2% |
| Laotians | 96.4 /100 | #102 | Exceptional 6.2% |
| Immigrants | Bulgaria | 96.3 /100 | #103 | Exceptional 6.2% |
| Mongolians | 96.2 /100 | #104 | Exceptional 6.2% |
Demographics Similar to Immigrants from Sweden by Disability Age 18 to 34
In terms of disability age 18 to 34, the demographic groups most similar to Immigrants from Sweden are Palestinian (6.4%, a difference of 0.010%), Immigrants from Europe (6.4%, a difference of 0.050%), Brazilian (6.4%, a difference of 0.090%), Immigrants from Honduras (6.4%, a difference of 0.13%), and Spanish American Indian (6.4%, a difference of 0.13%).
| Demographics | Rating | Rank | Disability Age 18 to 34 |
| Immigrants | Italy | 90.5 /100 | #129 | Exceptional 6.3% |
| Immigrants | Dominica | 90.5 /100 | #130 | Exceptional 6.3% |
| Immigrants | Saudi Arabia | 90.4 /100 | #131 | Exceptional 6.3% |
| Guatemalans | 89.6 /100 | #132 | Excellent 6.4% |
| Brazilians | 89.0 /100 | #133 | Excellent 6.4% |
| Immigrants | Europe | 88.8 /100 | #134 | Excellent 6.4% |
| Palestinians | 88.5 /100 | #135 | Excellent 6.4% |
| Immigrants | Sweden | 88.5 /100 | #136 | Excellent 6.4% |
| Immigrants | Honduras | 87.7 /100 | #137 | Excellent 6.4% |
| Spanish American Indians | 87.7 /100 | #138 | Excellent 6.4% |
| Immigrants | Belize | 87.4 /100 | #139 | Excellent 6.4% |
| Immigrants | Fiji | 87.3 /100 | #140 | Excellent 6.4% |
| Jamaicans | 86.8 /100 | #141 | Excellent 6.4% |
| South American Indians | 86.5 /100 | #142 | Excellent 6.4% |
| Immigrants | Latvia | 86.4 /100 | #143 | Excellent 6.4% |