Immigrants from Sweden vs Paraguayan Cognitive Disability
COMPARE
Immigrants from Sweden
Paraguayan
Cognitive Disability
Cognitive Disability Comparison
Immigrants from Sweden
Paraguayans
16.7%
COGNITIVE DISABILITY
99.4/ 100
METRIC RATING
70th/ 347
METRIC RANK
16.8%
COGNITIVE DISABILITY
98.0/ 100
METRIC RATING
103rd/ 347
METRIC RANK
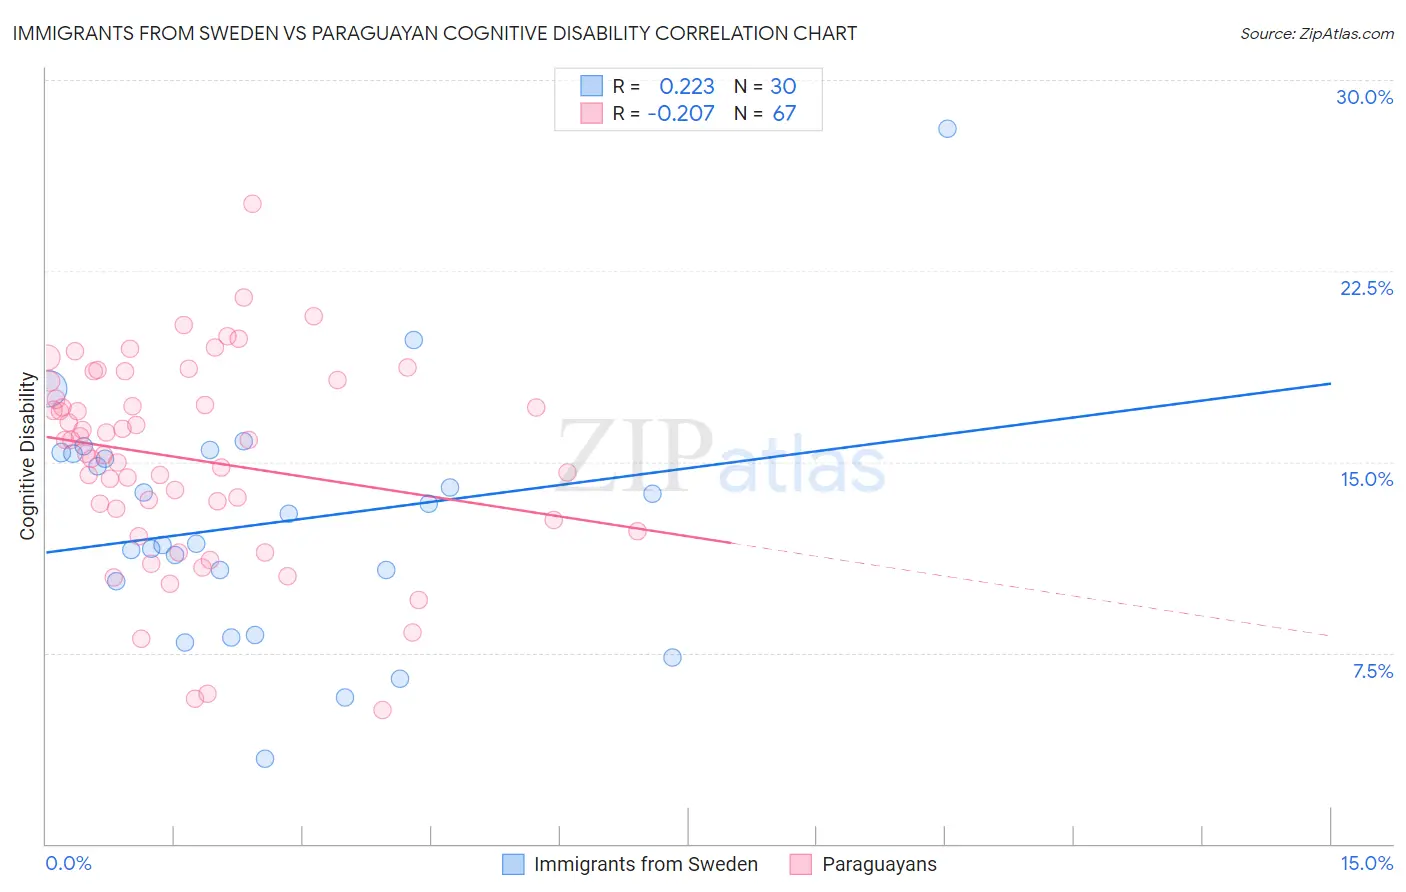
Immigrants from Sweden vs Paraguayan Cognitive Disability Correlation Chart
The statistical analysis conducted on geographies consisting of 164,746,937 people shows a weak positive correlation between the proportion of Immigrants from Sweden and percentage of population with cognitive disability in the United States with a correlation coefficient (R) of 0.223 and weighted average of 16.7%. Similarly, the statistical analysis conducted on geographies consisting of 95,106,732 people shows a weak negative correlation between the proportion of Paraguayans and percentage of population with cognitive disability in the United States with a correlation coefficient (R) of -0.207 and weighted average of 16.8%, a difference of 0.85%.
Cognitive Disability Correlation Summary
| Measurement | Immigrants from Sweden | Paraguayan |
| Minimum | 3.4% | 5.3% |
| Maximum | 28.1% | 25.1% |
| Range | 24.7% | 19.9% |
| Mean | 12.6% | 15.1% |
| Median | 12.4% | 15.9% |
| Interquartile 25% (IQ1) | 10.3% | 12.7% |
| Interquartile 75% (IQ3) | 15.3% | 18.2% |
| Interquartile Range (IQR) | 5.0% | 5.4% |
| Standard Deviation (Sample) | 4.8% | 3.9% |
| Standard Deviation (Population) | 4.7% | 3.9% |
Similar Demographics by Cognitive Disability
Demographics Similar to Immigrants from Sweden by Cognitive Disability
In terms of cognitive disability, the demographic groups most similar to Immigrants from Sweden are Immigrants from Uzbekistan (16.7%, a difference of 0.010%), Immigrants from Belgium (16.7%, a difference of 0.010%), German (16.7%, a difference of 0.020%), Burmese (16.7%, a difference of 0.030%), and Slavic (16.7%, a difference of 0.030%).
| Demographics | Rating | Rank | Cognitive Disability |
| Argentineans | 99.6 /100 | #63 | Exceptional 16.6% |
| Venezuelans | 99.6 /100 | #64 | Exceptional 16.6% |
| Colombians | 99.6 /100 | #65 | Exceptional 16.6% |
| Immigrants | Ukraine | 99.5 /100 | #66 | Exceptional 16.6% |
| Latvians | 99.5 /100 | #67 | Exceptional 16.6% |
| Ukrainians | 99.4 /100 | #68 | Exceptional 16.6% |
| Immigrants | Uzbekistan | 99.4 /100 | #69 | Exceptional 16.7% |
| Immigrants | Sweden | 99.4 /100 | #70 | Exceptional 16.7% |
| Immigrants | Belgium | 99.3 /100 | #71 | Exceptional 16.7% |
| Germans | 99.3 /100 | #72 | Exceptional 16.7% |
| Burmese | 99.3 /100 | #73 | Exceptional 16.7% |
| Slavs | 99.3 /100 | #74 | Exceptional 16.7% |
| Estonians | 99.3 /100 | #75 | Exceptional 16.7% |
| Immigrants | Serbia | 99.3 /100 | #76 | Exceptional 16.7% |
| Immigrants | Hungary | 99.3 /100 | #77 | Exceptional 16.7% |
Demographics Similar to Paraguayans by Cognitive Disability
In terms of cognitive disability, the demographic groups most similar to Paraguayans are Palestinian (16.8%, a difference of 0.0%), Immigrants from Eastern Asia (16.8%, a difference of 0.010%), Irish (16.8%, a difference of 0.050%), Northern European (16.8%, a difference of 0.050%), and Immigrants from Asia (16.8%, a difference of 0.070%).
| Demographics | Rating | Rank | Cognitive Disability |
| Finns | 98.5 /100 | #96 | Exceptional 16.8% |
| Dutch | 98.5 /100 | #97 | Exceptional 16.8% |
| Immigrants | Lebanon | 98.4 /100 | #98 | Exceptional 16.8% |
| Jordanians | 98.2 /100 | #99 | Exceptional 16.8% |
| Immigrants | Russia | 98.2 /100 | #100 | Exceptional 16.8% |
| Immigrants | Asia | 98.1 /100 | #101 | Exceptional 16.8% |
| Irish | 98.1 /100 | #102 | Exceptional 16.8% |
| Paraguayans | 98.0 /100 | #103 | Exceptional 16.8% |
| Palestinians | 98.0 /100 | #104 | Exceptional 16.8% |
| Immigrants | Eastern Asia | 97.9 /100 | #105 | Exceptional 16.8% |
| Northern Europeans | 97.8 /100 | #106 | Exceptional 16.8% |
| Immigrants | Nicaragua | 97.8 /100 | #107 | Exceptional 16.8% |
| Canadians | 97.5 /100 | #108 | Exceptional 16.8% |
| Albanians | 97.3 /100 | #109 | Exceptional 16.8% |
| Arapaho | 97.3 /100 | #110 | Exceptional 16.8% |