Turkish vs Immigrants from France Disability Age Over 75
COMPARE
Turkish
Immigrants from France
Disability Age Over 75
Disability Age Over 75 Comparison
Turks
Immigrants from France
45.7%
DISABILITY AGE OVER 75
99.8/ 100
METRIC RATING
45th/ 347
METRIC RANK
45.8%
DISABILITY AGE OVER 75
99.7/ 100
METRIC RATING
52nd/ 347
METRIC RANK
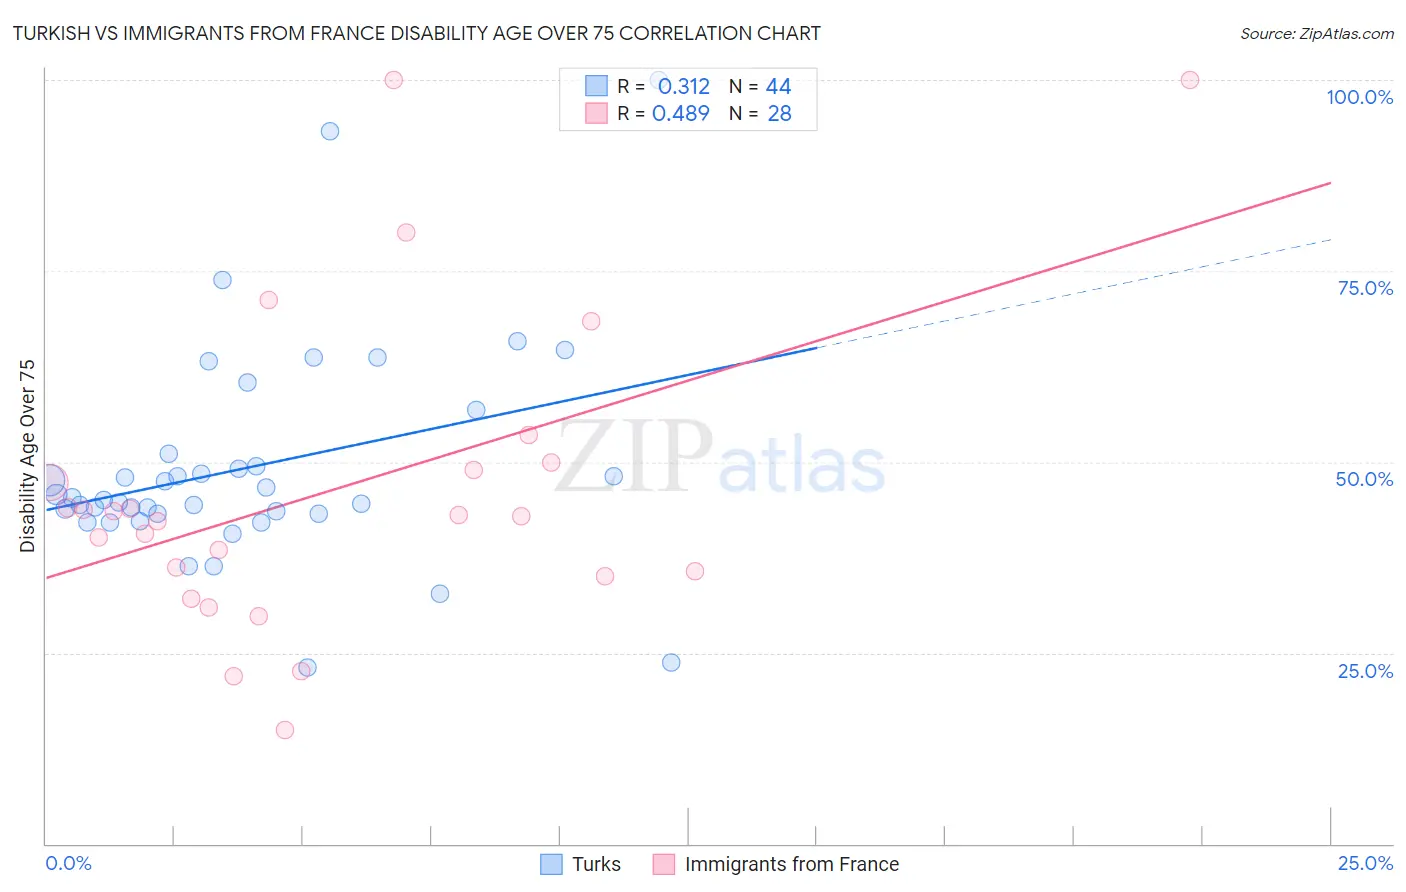
Turkish vs Immigrants from France Disability Age Over 75 Correlation Chart
The statistical analysis conducted on geographies consisting of 271,521,896 people shows a mild positive correlation between the proportion of Turks and percentage of population with a disability over the age of 75 in the United States with a correlation coefficient (R) of 0.312 and weighted average of 45.7%. Similarly, the statistical analysis conducted on geographies consisting of 287,676,099 people shows a moderate positive correlation between the proportion of Immigrants from France and percentage of population with a disability over the age of 75 in the United States with a correlation coefficient (R) of 0.489 and weighted average of 45.8%, a difference of 0.29%.
Disability Age Over 75 Correlation Summary
| Measurement | Turkish | Immigrants from France |
| Minimum | 23.1% | 15.0% |
| Maximum | 100.0% | 100.0% |
| Range | 76.9% | 85.0% |
| Mean | 49.3% | 46.5% |
| Median | 45.2% | 43.0% |
| Interquartile 25% (IQ1) | 43.2% | 35.4% |
| Interquartile 75% (IQ3) | 50.2% | 49.5% |
| Interquartile Range (IQR) | 7.0% | 14.1% |
| Standard Deviation (Sample) | 14.5% | 20.6% |
| Standard Deviation (Population) | 14.3% | 20.2% |
Demographics Similar to Turks and Immigrants from France by Disability Age Over 75
In terms of disability age over 75, the demographic groups most similar to Turks are Australian (45.7%, a difference of 0.0%), Swedish (45.7%, a difference of 0.030%), Greek (45.6%, a difference of 0.040%), Czech (45.7%, a difference of 0.040%), and Immigrants from Canada (45.7%, a difference of 0.040%). Similarly, the demographic groups most similar to Immigrants from France are Immigrants from Italy (45.8%, a difference of 0.020%), Belgian (45.8%, a difference of 0.050%), Immigrants from Korea (45.8%, a difference of 0.050%), Slovak (45.8%, a difference of 0.090%), and Maltese (45.8%, a difference of 0.10%).
| Demographics | Rating | Rank | Disability Age Over 75 |
| Italians | 99.9 /100 | #38 | Exceptional 45.6% |
| Estonians | 99.9 /100 | #39 | Exceptional 45.6% |
| Slovenes | 99.9 /100 | #40 | Exceptional 45.6% |
| Immigrants | Singapore | 99.8 /100 | #41 | Exceptional 45.6% |
| Greeks | 99.8 /100 | #42 | Exceptional 45.6% |
| Czechs | 99.8 /100 | #43 | Exceptional 45.7% |
| Australians | 99.8 /100 | #44 | Exceptional 45.7% |
| Turks | 99.8 /100 | #45 | Exceptional 45.7% |
| Swedes | 99.8 /100 | #46 | Exceptional 45.7% |
| Immigrants | Canada | 99.8 /100 | #47 | Exceptional 45.7% |
| Croatians | 99.8 /100 | #48 | Exceptional 45.7% |
| Immigrants | North America | 99.8 /100 | #49 | Exceptional 45.7% |
| Belgians | 99.7 /100 | #50 | Exceptional 45.8% |
| Immigrants | Korea | 99.7 /100 | #51 | Exceptional 45.8% |
| Immigrants | France | 99.7 /100 | #52 | Exceptional 45.8% |
| Immigrants | Italy | 99.7 /100 | #53 | Exceptional 45.8% |
| Slovaks | 99.6 /100 | #54 | Exceptional 45.8% |
| Maltese | 99.6 /100 | #55 | Exceptional 45.8% |
| Immigrants | Netherlands | 99.6 /100 | #56 | Exceptional 45.9% |
| Immigrants | Turkey | 99.6 /100 | #57 | Exceptional 45.9% |
| Immigrants | Israel | 99.6 /100 | #58 | Exceptional 45.9% |