Turkish vs Immigrants from France Disability Age 65 to 74
COMPARE
Turkish
Immigrants from France
Disability Age 65 to 74
Disability Age 65 to 74 Comparison
Turks
Immigrants from France
21.0%
DISABILITY AGE 65 TO 74
99.9/ 100
METRIC RATING
32nd/ 347
METRIC RANK
21.5%
DISABILITY AGE 65 TO 74
99.6/ 100
METRIC RATING
52nd/ 347
METRIC RANK
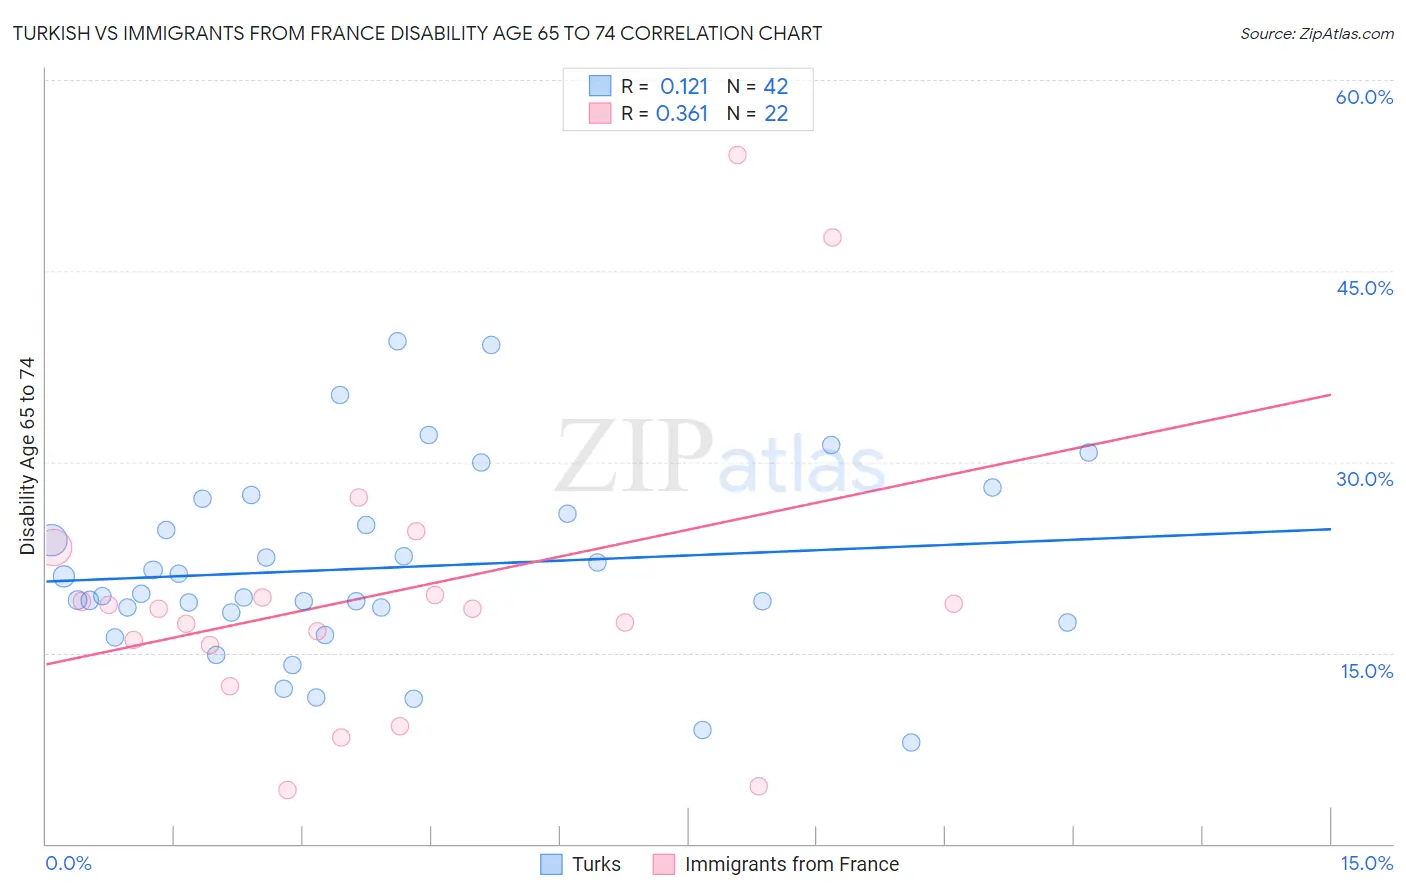
Turkish vs Immigrants from France Disability Age 65 to 74 Correlation Chart
The statistical analysis conducted on geographies consisting of 271,478,779 people shows a poor positive correlation between the proportion of Turks and percentage of population with a disability between the ages 65 and 75 in the United States with a correlation coefficient (R) of 0.121 and weighted average of 21.0%. Similarly, the statistical analysis conducted on geographies consisting of 287,648,161 people shows a mild positive correlation between the proportion of Immigrants from France and percentage of population with a disability between the ages 65 and 75 in the United States with a correlation coefficient (R) of 0.361 and weighted average of 21.5%, a difference of 2.2%.
Disability Age 65 to 74 Correlation Summary
| Measurement | Turkish | Immigrants from France |
| Minimum | 7.9% | 4.3% |
| Maximum | 39.4% | 54.1% |
| Range | 31.5% | 49.8% |
| Mean | 21.7% | 19.6% |
| Median | 19.6% | 18.5% |
| Interquartile 25% (IQ1) | 18.2% | 15.6% |
| Interquartile 75% (IQ3) | 26.0% | 19.5% |
| Interquartile Range (IQR) | 7.8% | 3.9% |
| Standard Deviation (Sample) | 7.4% | 11.7% |
| Standard Deviation (Population) | 7.3% | 11.4% |
Demographics Similar to Turks and Immigrants from France by Disability Age 65 to 74
In terms of disability age 65 to 74, the demographic groups most similar to Turks are Immigrants from Argentina (21.1%, a difference of 0.20%), Immigrants from Sri Lanka (21.1%, a difference of 0.23%), Bulgarian (21.1%, a difference of 0.29%), Immigrants from Switzerland (21.1%, a difference of 0.48%), and Israeli (21.2%, a difference of 0.59%). Similarly, the demographic groups most similar to Immigrants from France are Immigrants from Serbia (21.4%, a difference of 0.22%), Immigrants from Malaysia (21.4%, a difference of 0.45%), Luxembourger (21.4%, a difference of 0.47%), Lithuanian (21.4%, a difference of 0.48%), and Immigrants from Turkey (21.4%, a difference of 0.53%).
| Demographics | Rating | Rank | Disability Age 65 to 74 |
| Turks | 99.9 /100 | #32 | Exceptional 21.0% |
| Immigrants | Argentina | 99.9 /100 | #33 | Exceptional 21.1% |
| Immigrants | Sri Lanka | 99.9 /100 | #34 | Exceptional 21.1% |
| Bulgarians | 99.9 /100 | #35 | Exceptional 21.1% |
| Immigrants | Switzerland | 99.8 /100 | #36 | Exceptional 21.1% |
| Israelis | 99.8 /100 | #37 | Exceptional 21.2% |
| Russians | 99.8 /100 | #38 | Exceptional 21.2% |
| Argentineans | 99.8 /100 | #39 | Exceptional 21.2% |
| Latvians | 99.8 /100 | #40 | Exceptional 21.2% |
| Immigrants | Austria | 99.8 /100 | #41 | Exceptional 21.2% |
| Macedonians | 99.7 /100 | #42 | Exceptional 21.3% |
| Immigrants | Croatia | 99.7 /100 | #43 | Exceptional 21.3% |
| Estonians | 99.7 /100 | #44 | Exceptional 21.4% |
| Asians | 99.7 /100 | #45 | Exceptional 21.4% |
| Immigrants | Turkey | 99.7 /100 | #46 | Exceptional 21.4% |
| Immigrants | Bulgaria | 99.7 /100 | #47 | Exceptional 21.4% |
| Lithuanians | 99.7 /100 | #48 | Exceptional 21.4% |
| Luxembourgers | 99.7 /100 | #49 | Exceptional 21.4% |
| Immigrants | Malaysia | 99.7 /100 | #50 | Exceptional 21.4% |
| Immigrants | Serbia | 99.6 /100 | #51 | Exceptional 21.4% |
| Immigrants | France | 99.6 /100 | #52 | Exceptional 21.5% |