Turkish vs Blackfeet Disability Age Over 75
COMPARE
Turkish
Blackfeet
Disability Age Over 75
Disability Age Over 75 Comparison
Turks
Blackfeet
45.7%
DISABILITY AGE OVER 75
99.8/ 100
METRIC RATING
45th/ 347
METRIC RANK
48.8%
DISABILITY AGE OVER 75
0.5/ 100
METRIC RATING
257th/ 347
METRIC RANK
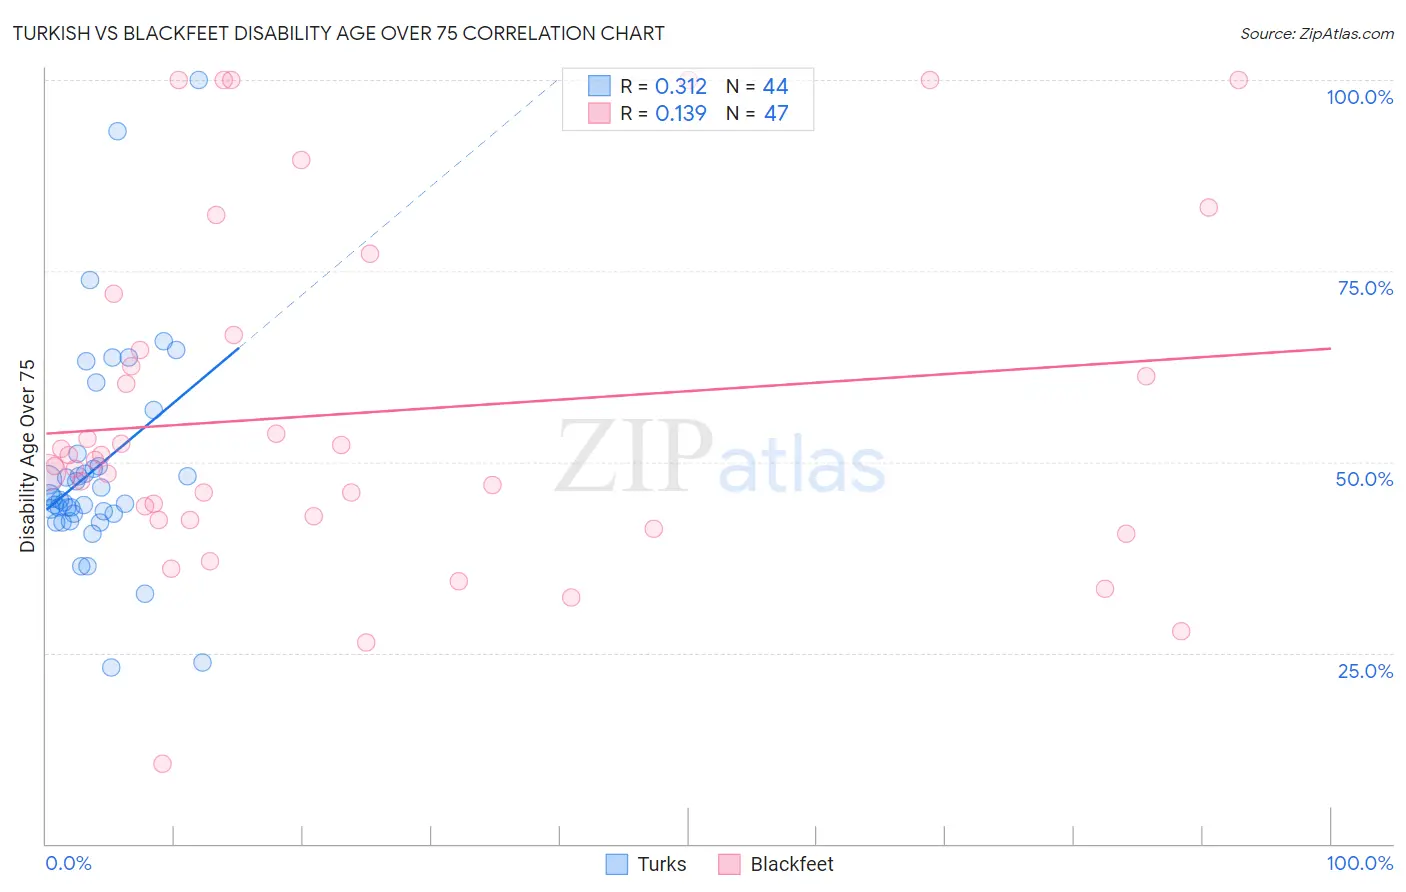
Turkish vs Blackfeet Disability Age Over 75 Correlation Chart
The statistical analysis conducted on geographies consisting of 271,521,896 people shows a mild positive correlation between the proportion of Turks and percentage of population with a disability over the age of 75 in the United States with a correlation coefficient (R) of 0.312 and weighted average of 45.7%. Similarly, the statistical analysis conducted on geographies consisting of 309,061,440 people shows a poor positive correlation between the proportion of Blackfeet and percentage of population with a disability over the age of 75 in the United States with a correlation coefficient (R) of 0.139 and weighted average of 48.8%, a difference of 6.8%.
Disability Age Over 75 Correlation Summary
| Measurement | Turkish | Blackfeet |
| Minimum | 23.1% | 10.4% |
| Maximum | 100.0% | 100.0% |
| Range | 76.9% | 89.6% |
| Mean | 49.3% | 56.4% |
| Median | 45.2% | 50.3% |
| Interquartile 25% (IQ1) | 43.2% | 42.5% |
| Interquartile 75% (IQ3) | 50.2% | 66.7% |
| Interquartile Range (IQR) | 7.0% | 24.2% |
| Standard Deviation (Sample) | 14.5% | 22.5% |
| Standard Deviation (Population) | 14.3% | 22.2% |
Similar Demographics by Disability Age Over 75
Demographics Similar to Turks by Disability Age Over 75
In terms of disability age over 75, the demographic groups most similar to Turks are Australian (45.7%, a difference of 0.0%), Swedish (45.7%, a difference of 0.030%), Greek (45.6%, a difference of 0.040%), Czech (45.7%, a difference of 0.040%), and Immigrants from Canada (45.7%, a difference of 0.040%).
| Demographics | Rating | Rank | Disability Age Over 75 |
| Italians | 99.9 /100 | #38 | Exceptional 45.6% |
| Estonians | 99.9 /100 | #39 | Exceptional 45.6% |
| Slovenes | 99.9 /100 | #40 | Exceptional 45.6% |
| Immigrants | Singapore | 99.8 /100 | #41 | Exceptional 45.6% |
| Greeks | 99.8 /100 | #42 | Exceptional 45.6% |
| Czechs | 99.8 /100 | #43 | Exceptional 45.7% |
| Australians | 99.8 /100 | #44 | Exceptional 45.7% |
| Turks | 99.8 /100 | #45 | Exceptional 45.7% |
| Swedes | 99.8 /100 | #46 | Exceptional 45.7% |
| Immigrants | Canada | 99.8 /100 | #47 | Exceptional 45.7% |
| Croatians | 99.8 /100 | #48 | Exceptional 45.7% |
| Immigrants | North America | 99.8 /100 | #49 | Exceptional 45.7% |
| Belgians | 99.7 /100 | #50 | Exceptional 45.8% |
| Immigrants | Korea | 99.7 /100 | #51 | Exceptional 45.8% |
| Immigrants | France | 99.7 /100 | #52 | Exceptional 45.8% |
Demographics Similar to Blackfeet by Disability Age Over 75
In terms of disability age over 75, the demographic groups most similar to Blackfeet are Immigrants from Philippines (48.8%, a difference of 0.040%), Immigrants from Congo (48.7%, a difference of 0.050%), Chinese (48.7%, a difference of 0.060%), Immigrants from Vietnam (48.7%, a difference of 0.10%), and Central American (48.8%, a difference of 0.11%).
| Demographics | Rating | Rank | Disability Age Over 75 |
| West Indians | 0.8 /100 | #250 | Tragic 48.6% |
| Koreans | 0.8 /100 | #251 | Tragic 48.6% |
| Immigrants | South Eastern Asia | 0.7 /100 | #252 | Tragic 48.7% |
| British West Indians | 0.6 /100 | #253 | Tragic 48.7% |
| Immigrants | Vietnam | 0.6 /100 | #254 | Tragic 48.7% |
| Chinese | 0.5 /100 | #255 | Tragic 48.7% |
| Immigrants | Congo | 0.5 /100 | #256 | Tragic 48.7% |
| Blackfeet | 0.5 /100 | #257 | Tragic 48.8% |
| Immigrants | Philippines | 0.4 /100 | #258 | Tragic 48.8% |
| Central Americans | 0.4 /100 | #259 | Tragic 48.8% |
| Immigrants | Afghanistan | 0.4 /100 | #260 | Tragic 48.8% |
| Africans | 0.3 /100 | #261 | Tragic 48.9% |
| Immigrants | West Indies | 0.3 /100 | #262 | Tragic 48.9% |
| Salvadorans | 0.3 /100 | #263 | Tragic 48.9% |
| Immigrants | Honduras | 0.3 /100 | #264 | Tragic 48.9% |