Trinidadian and Tobagonian vs Immigrants from Lithuania Cognitive Disability
COMPARE
Trinidadian and Tobagonian
Immigrants from Lithuania
Cognitive Disability
Cognitive Disability Comparison
Trinidadians and Tobagonians
Immigrants from Lithuania
17.9%
COGNITIVE DISABILITY
0.8/ 100
METRIC RATING
245th/ 347
METRIC RANK
16.0%
COGNITIVE DISABILITY
100.0/ 100
METRIC RATING
4th/ 347
METRIC RANK
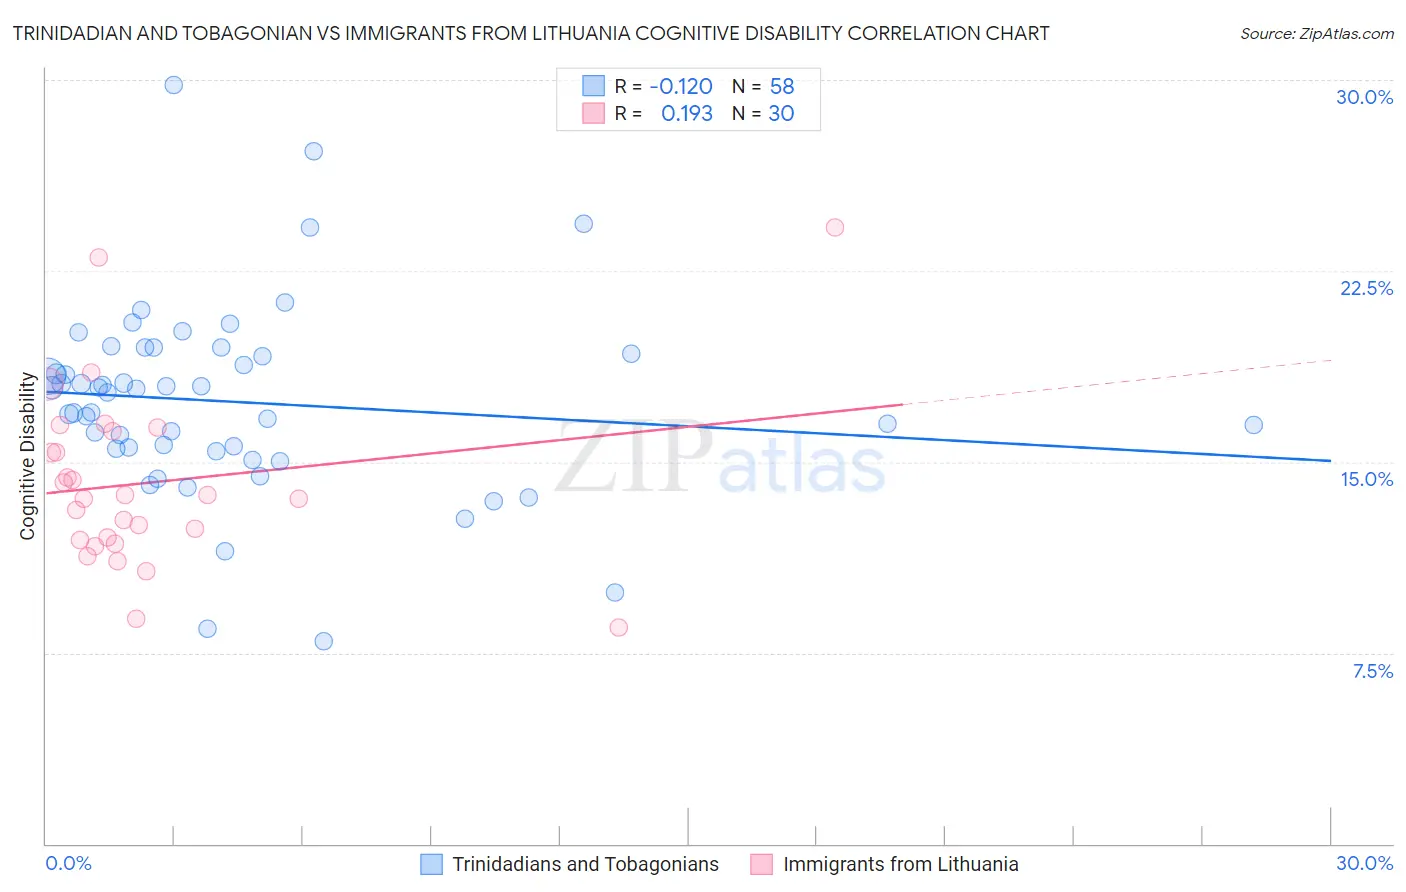
Trinidadian and Tobagonian vs Immigrants from Lithuania Cognitive Disability Correlation Chart
The statistical analysis conducted on geographies consisting of 219,836,057 people shows a poor negative correlation between the proportion of Trinidadians and Tobagonians and percentage of population with cognitive disability in the United States with a correlation coefficient (R) of -0.120 and weighted average of 17.9%. Similarly, the statistical analysis conducted on geographies consisting of 117,722,792 people shows a poor positive correlation between the proportion of Immigrants from Lithuania and percentage of population with cognitive disability in the United States with a correlation coefficient (R) of 0.193 and weighted average of 16.0%, a difference of 12.0%.
Cognitive Disability Correlation Summary
| Measurement | Trinidadian and Tobagonian | Immigrants from Lithuania |
| Minimum | 7.9% | 8.5% |
| Maximum | 29.8% | 24.2% |
| Range | 21.9% | 15.7% |
| Mean | 17.4% | 14.2% |
| Median | 17.8% | 13.6% |
| Interquartile 25% (IQ1) | 15.5% | 11.9% |
| Interquartile 75% (IQ3) | 19.2% | 16.2% |
| Interquartile Range (IQR) | 3.7% | 4.3% |
| Standard Deviation (Sample) | 3.8% | 3.5% |
| Standard Deviation (Population) | 3.8% | 3.5% |
Similar Demographics by Cognitive Disability
Demographics Similar to Trinidadians and Tobagonians by Cognitive Disability
In terms of cognitive disability, the demographic groups most similar to Trinidadians and Tobagonians are Immigrants from Thailand (17.9%, a difference of 0.020%), Jamaican (17.9%, a difference of 0.090%), Samoan (17.9%, a difference of 0.090%), French American Indian (17.9%, a difference of 0.10%), and Immigrants from Bangladesh (17.8%, a difference of 0.13%).
| Demographics | Rating | Rank | Cognitive Disability |
| Cheyenne | 1.7 /100 | #238 | Tragic 17.8% |
| Cajuns | 1.4 /100 | #239 | Tragic 17.8% |
| Iraqis | 1.4 /100 | #240 | Tragic 17.8% |
| Mexicans | 1.1 /100 | #241 | Tragic 17.8% |
| Paiute | 1.1 /100 | #242 | Tragic 17.8% |
| Immigrants | Bangladesh | 1.0 /100 | #243 | Tragic 17.8% |
| Jamaicans | 0.9 /100 | #244 | Tragic 17.9% |
| Trinidadians and Tobagonians | 0.8 /100 | #245 | Tragic 17.9% |
| Immigrants | Thailand | 0.8 /100 | #246 | Tragic 17.9% |
| Samoans | 0.7 /100 | #247 | Tragic 17.9% |
| French American Indians | 0.7 /100 | #248 | Tragic 17.9% |
| Cree | 0.7 /100 | #249 | Tragic 17.9% |
| Immigrants | Ethiopia | 0.7 /100 | #250 | Tragic 17.9% |
| Malaysians | 0.6 /100 | #251 | Tragic 17.9% |
| Immigrants | Grenada | 0.6 /100 | #252 | Tragic 17.9% |
Demographics Similar to Immigrants from Lithuania by Cognitive Disability
In terms of cognitive disability, the demographic groups most similar to Immigrants from Lithuania are Chinese (15.9%, a difference of 0.18%), Immigrants from India (15.9%, a difference of 0.27%), Immigrants from Hong Kong (16.0%, a difference of 0.41%), Thai (16.1%, a difference of 1.0%), and Immigrants from Ireland (16.1%, a difference of 1.1%).
| Demographics | Rating | Rank | Cognitive Disability |
| Immigrants | Taiwan | 100.0 /100 | #1 | Exceptional 15.7% |
| Immigrants | India | 100.0 /100 | #2 | Exceptional 15.9% |
| Chinese | 100.0 /100 | #3 | Exceptional 15.9% |
| Immigrants | Lithuania | 100.0 /100 | #4 | Exceptional 16.0% |
| Immigrants | Hong Kong | 100.0 /100 | #5 | Exceptional 16.0% |
| Thais | 100.0 /100 | #6 | Exceptional 16.1% |
| Immigrants | Ireland | 100.0 /100 | #7 | Exceptional 16.1% |
| Immigrants | Poland | 100.0 /100 | #8 | Exceptional 16.1% |
| Assyrians/Chaldeans/Syriacs | 100.0 /100 | #9 | Exceptional 16.2% |
| Immigrants | Scotland | 100.0 /100 | #10 | Exceptional 16.2% |
| Immigrants | Czechoslovakia | 100.0 /100 | #11 | Exceptional 16.2% |
| Maltese | 100.0 /100 | #12 | Exceptional 16.2% |
| Lithuanians | 100.0 /100 | #13 | Exceptional 16.3% |
| Immigrants | Austria | 100.0 /100 | #14 | Exceptional 16.3% |
| Immigrants | Greece | 100.0 /100 | #15 | Exceptional 16.3% |