Trinidadian and Tobagonian vs Immigrants from Chile Unemployment Among Ages 30 to 34 years
COMPARE
Trinidadian and Tobagonian
Immigrants from Chile
Unemployment Among Ages 30 to 34 years
Unemployment Among Ages 30 to 34 years Comparison
Trinidadians and Tobagonians
Immigrants from Chile
6.5%
UNEMPLOYMENT AMONG AGES 30 TO 34 YEARS
0.0/ 100
METRIC RATING
295th/ 347
METRIC RANK
5.3%
UNEMPLOYMENT AMONG AGES 30 TO 34 YEARS
86.7/ 100
METRIC RATING
109th/ 347
METRIC RANK
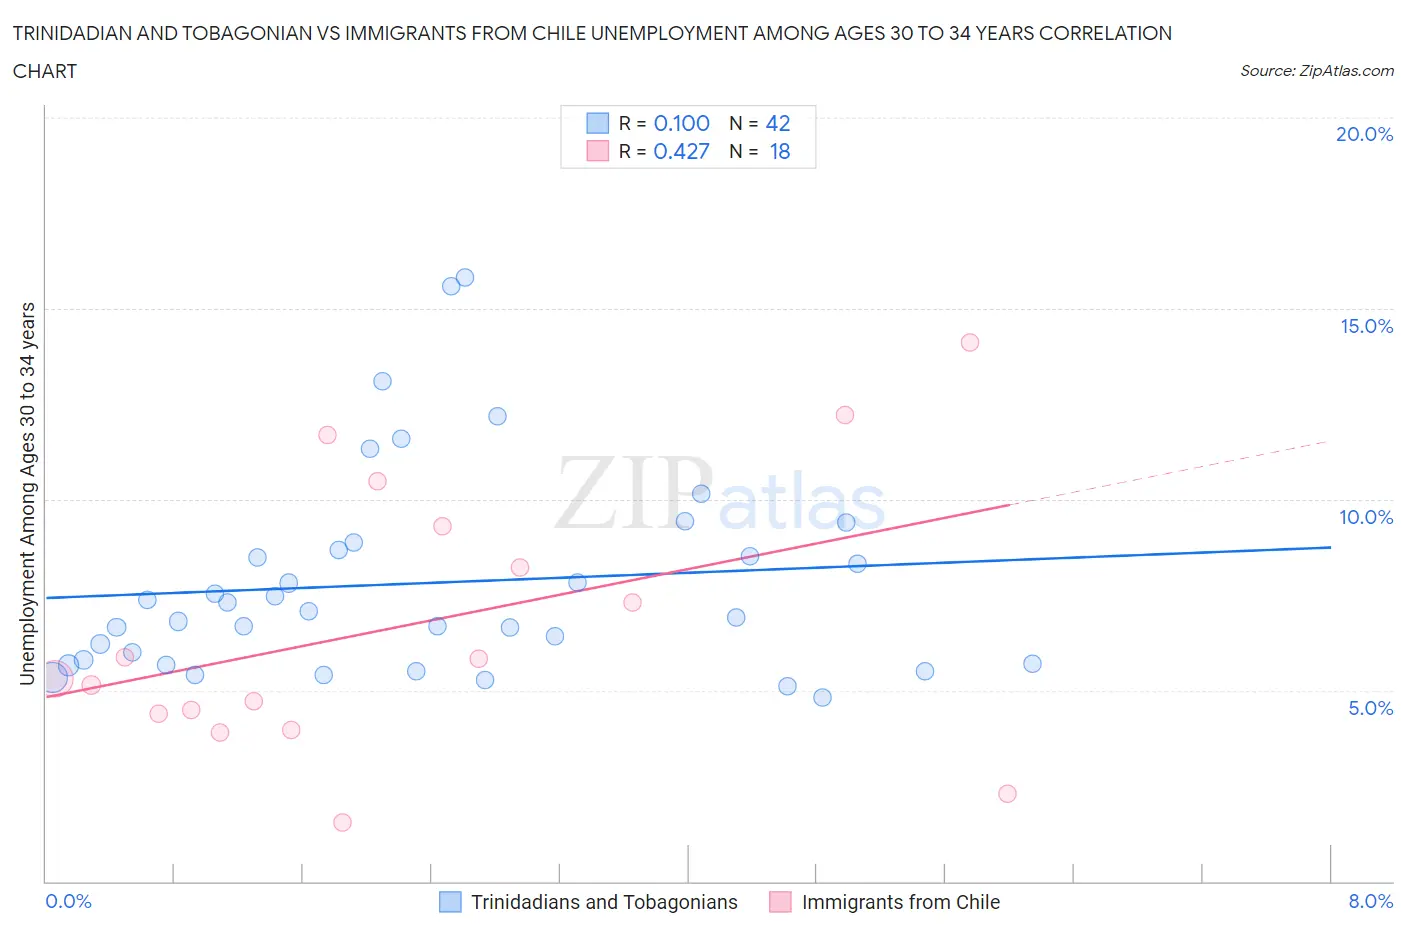
Trinidadian and Tobagonian vs Immigrants from Chile Unemployment Among Ages 30 to 34 years Correlation Chart
The statistical analysis conducted on geographies consisting of 213,654,517 people shows a poor positive correlation between the proportion of Trinidadians and Tobagonians and unemployment rate among population between the ages 30 and 34 in the United States with a correlation coefficient (R) of 0.100 and weighted average of 6.5%. Similarly, the statistical analysis conducted on geographies consisting of 212,636,811 people shows a moderate positive correlation between the proportion of Immigrants from Chile and unemployment rate among population between the ages 30 and 34 in the United States with a correlation coefficient (R) of 0.427 and weighted average of 5.3%, a difference of 23.9%.
Unemployment Among Ages 30 to 34 years Correlation Summary
| Measurement | Trinidadian and Tobagonian | Immigrants from Chile |
| Minimum | 4.8% | 1.5% |
| Maximum | 15.8% | 14.1% |
| Range | 11.0% | 12.6% |
| Mean | 7.8% | 6.7% |
| Median | 7.0% | 5.6% |
| Interquartile 25% (IQ1) | 5.7% | 4.4% |
| Interquartile 75% (IQ3) | 8.7% | 9.3% |
| Interquartile Range (IQR) | 3.0% | 4.9% |
| Standard Deviation (Sample) | 2.7% | 3.6% |
| Standard Deviation (Population) | 2.7% | 3.5% |
Similar Demographics by Unemployment Among Ages 30 to 34 years
Demographics Similar to Trinidadians and Tobagonians by Unemployment Among Ages 30 to 34 years
In terms of unemployment among ages 30 to 34 years, the demographic groups most similar to Trinidadians and Tobagonians are Immigrants from Jamaica (6.5%, a difference of 0.050%), Creek (6.6%, a difference of 0.15%), Barbadian (6.5%, a difference of 0.24%), Immigrants from Barbados (6.6%, a difference of 0.40%), and Dutch West Indian (6.6%, a difference of 0.50%).
| Demographics | Rating | Rank | Unemployment Among Ages 30 to 34 years |
| Senegalese | 0.0 /100 | #288 | Tragic 6.4% |
| Menominee | 0.0 /100 | #289 | Tragic 6.4% |
| Immigrants | Trinidad and Tobago | 0.0 /100 | #290 | Tragic 6.5% |
| Jamaicans | 0.0 /100 | #291 | Tragic 6.5% |
| Vietnamese | 0.0 /100 | #292 | Tragic 6.5% |
| West Indians | 0.0 /100 | #293 | Tragic 6.5% |
| Barbadians | 0.0 /100 | #294 | Tragic 6.5% |
| Trinidadians and Tobagonians | 0.0 /100 | #295 | Tragic 6.5% |
| Immigrants | Jamaica | 0.0 /100 | #296 | Tragic 6.5% |
| Creek | 0.0 /100 | #297 | Tragic 6.6% |
| Immigrants | Barbados | 0.0 /100 | #298 | Tragic 6.6% |
| Dutch West Indians | 0.0 /100 | #299 | Tragic 6.6% |
| Bahamians | 0.0 /100 | #300 | Tragic 6.6% |
| Belizeans | 0.0 /100 | #301 | Tragic 6.6% |
| Delaware | 0.0 /100 | #302 | Tragic 6.7% |
Demographics Similar to Immigrants from Chile by Unemployment Among Ages 30 to 34 years
In terms of unemployment among ages 30 to 34 years, the demographic groups most similar to Immigrants from Chile are Egyptian (5.3%, a difference of 0.050%), Immigrants from Middle Africa (5.3%, a difference of 0.060%), Icelander (5.3%, a difference of 0.070%), Immigrants from Pakistan (5.3%, a difference of 0.070%), and Swiss (5.3%, a difference of 0.12%).
| Demographics | Rating | Rank | Unemployment Among Ages 30 to 34 years |
| Immigrants | Switzerland | 88.8 /100 | #102 | Excellent 5.3% |
| Immigrants | Jordan | 88.8 /100 | #103 | Excellent 5.3% |
| Northern Europeans | 87.9 /100 | #104 | Excellent 5.3% |
| Argentineans | 87.9 /100 | #105 | Excellent 5.3% |
| Croatians | 87.6 /100 | #106 | Excellent 5.3% |
| Icelanders | 87.2 /100 | #107 | Excellent 5.3% |
| Immigrants | Middle Africa | 87.1 /100 | #108 | Excellent 5.3% |
| Immigrants | Chile | 86.7 /100 | #109 | Excellent 5.3% |
| Egyptians | 86.4 /100 | #110 | Excellent 5.3% |
| Immigrants | Pakistan | 86.2 /100 | #111 | Excellent 5.3% |
| Swiss | 85.9 /100 | #112 | Excellent 5.3% |
| Immigrants | Spain | 85.6 /100 | #113 | Excellent 5.3% |
| Estonians | 83.7 /100 | #114 | Excellent 5.3% |
| Immigrants | Albania | 83.4 /100 | #115 | Excellent 5.3% |
| Eastern Europeans | 83.2 /100 | #116 | Excellent 5.3% |