Trinidadian and Tobagonian vs Argentinean Disability Age 35 to 64
COMPARE
Trinidadian and Tobagonian
Argentinean
Disability Age 35 to 64
Disability Age 35 to 64 Comparison
Trinidadians and Tobagonians
Argentineans
11.4%
DISABILITY AGE 35 TO 64
40.8/ 100
METRIC RATING
181st/ 347
METRIC RANK
9.4%
DISABILITY AGE 35 TO 64
100.0/ 100
METRIC RATING
23rd/ 347
METRIC RANK
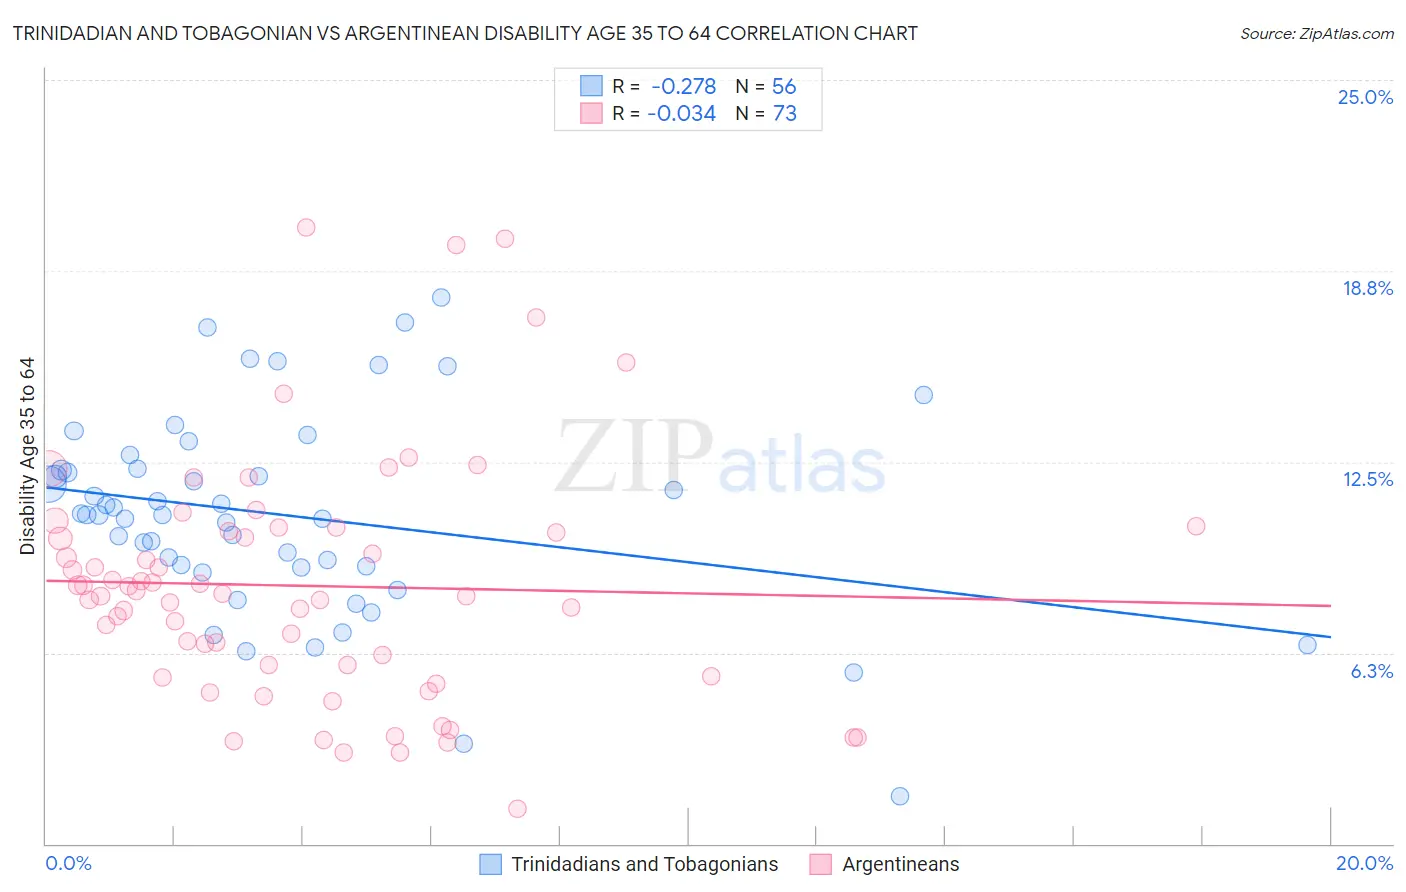
Trinidadian and Tobagonian vs Argentinean Disability Age 35 to 64 Correlation Chart
The statistical analysis conducted on geographies consisting of 219,688,298 people shows a weak negative correlation between the proportion of Trinidadians and Tobagonians and percentage of population with a disability between the ages 34 and 64 in the United States with a correlation coefficient (R) of -0.278 and weighted average of 11.4%. Similarly, the statistical analysis conducted on geographies consisting of 296,962,722 people shows no correlation between the proportion of Argentineans and percentage of population with a disability between the ages 34 and 64 in the United States with a correlation coefficient (R) of -0.034 and weighted average of 9.4%, a difference of 21.0%.
Disability Age 35 to 64 Correlation Summary
| Measurement | Trinidadian and Tobagonian | Argentinean |
| Minimum | 1.6% | 1.1% |
| Maximum | 17.9% | 20.2% |
| Range | 16.3% | 19.0% |
| Mean | 10.8% | 8.4% |
| Median | 10.8% | 8.2% |
| Interquartile 25% (IQ1) | 9.1% | 5.7% |
| Interquartile 75% (IQ3) | 12.3% | 10.3% |
| Interquartile Range (IQR) | 3.2% | 4.6% |
| Standard Deviation (Sample) | 3.3% | 3.9% |
| Standard Deviation (Population) | 3.3% | 3.9% |
Similar Demographics by Disability Age 35 to 64
Demographics Similar to Trinidadians and Tobagonians by Disability Age 35 to 64
In terms of disability age 35 to 64, the demographic groups most similar to Trinidadians and Tobagonians are Immigrants from Caribbean (11.3%, a difference of 0.060%), Immigrants from Barbados (11.3%, a difference of 0.070%), Icelander (11.4%, a difference of 0.090%), Polish (11.3%, a difference of 0.10%), and Immigrants from Oceania (11.4%, a difference of 0.10%).
| Demographics | Rating | Rank | Disability Age 35 to 64 |
| Immigrants | Fiji | 50.0 /100 | #174 | Average 11.3% |
| Czechs | 47.9 /100 | #175 | Average 11.3% |
| Ugandans | 43.7 /100 | #176 | Average 11.3% |
| Immigrants | Eastern Africa | 42.2 /100 | #177 | Average 11.3% |
| Poles | 42.0 /100 | #178 | Average 11.3% |
| Immigrants | Barbados | 41.6 /100 | #179 | Average 11.3% |
| Immigrants | Caribbean | 41.5 /100 | #180 | Average 11.3% |
| Trinidadians and Tobagonians | 40.8 /100 | #181 | Average 11.4% |
| Icelanders | 39.7 /100 | #182 | Fair 11.4% |
| Immigrants | Oceania | 39.5 /100 | #183 | Fair 11.4% |
| Kenyans | 39.2 /100 | #184 | Fair 11.4% |
| Danes | 36.8 /100 | #185 | Fair 11.4% |
| Slovenes | 36.6 /100 | #186 | Fair 11.4% |
| Immigrants | Bosnia and Herzegovina | 35.2 /100 | #187 | Fair 11.4% |
| Northern Europeans | 34.9 /100 | #188 | Fair 11.4% |
Demographics Similar to Argentineans by Disability Age 35 to 64
In terms of disability age 35 to 64, the demographic groups most similar to Argentineans are Asian (9.4%, a difference of 0.010%), Cypriot (9.4%, a difference of 0.22%), Okinawan (9.4%, a difference of 0.25%), Venezuelan (9.4%, a difference of 0.31%), and Immigrants from Argentina (9.3%, a difference of 0.68%).
| Demographics | Rating | Rank | Disability Age 35 to 64 |
| Immigrants | Korea | 100.0 /100 | #16 | Exceptional 9.0% |
| Burmese | 100.0 /100 | #17 | Exceptional 9.2% |
| Soviet Union | 100.0 /100 | #18 | Exceptional 9.2% |
| Immigrants | Venezuela | 100.0 /100 | #19 | Exceptional 9.3% |
| Immigrants | Argentina | 100.0 /100 | #20 | Exceptional 9.3% |
| Okinawans | 100.0 /100 | #21 | Exceptional 9.4% |
| Cypriots | 100.0 /100 | #22 | Exceptional 9.4% |
| Argentineans | 100.0 /100 | #23 | Exceptional 9.4% |
| Asians | 100.0 /100 | #24 | Exceptional 9.4% |
| Venezuelans | 100.0 /100 | #25 | Exceptional 9.4% |
| Immigrants | Sri Lanka | 100.0 /100 | #26 | Exceptional 9.5% |
| Immigrants | Asia | 100.0 /100 | #27 | Exceptional 9.5% |
| Immigrants | Pakistan | 100.0 /100 | #28 | Exceptional 9.5% |
| Immigrants | Ireland | 100.0 /100 | #29 | Exceptional 9.5% |
| Immigrants | Japan | 100.0 /100 | #30 | Exceptional 9.5% |