Albanian vs Argentinean Disability Age 35 to 64
COMPARE
Albanian
Argentinean
Disability Age 35 to 64
Disability Age 35 to 64 Comparison
Albanians
Argentineans
10.6%
DISABILITY AGE 35 TO 64
94.2/ 100
METRIC RATING
125th/ 347
METRIC RANK
9.4%
DISABILITY AGE 35 TO 64
100.0/ 100
METRIC RATING
23rd/ 347
METRIC RANK
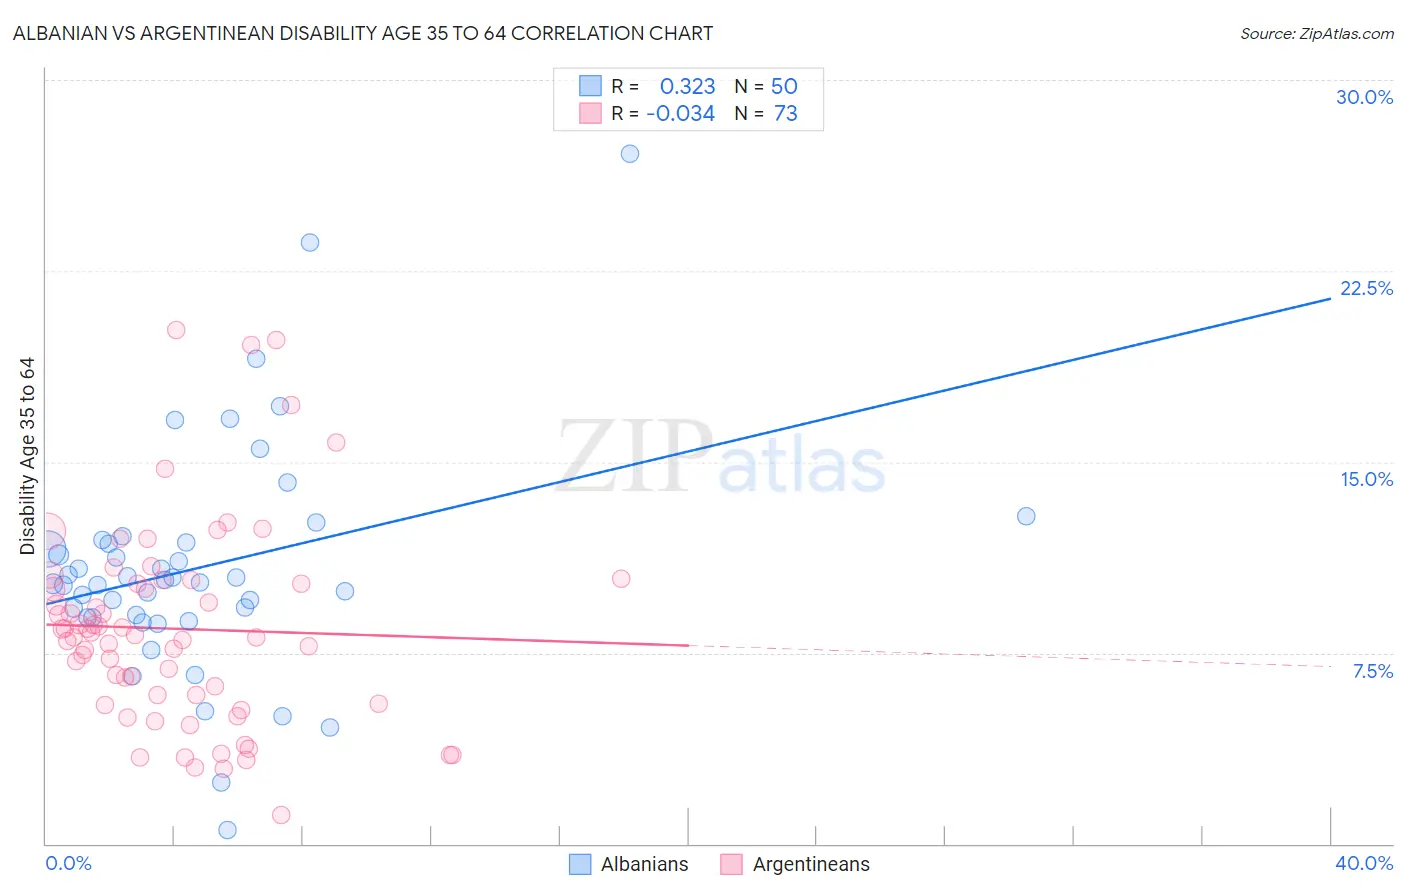
Albanian vs Argentinean Disability Age 35 to 64 Correlation Chart
The statistical analysis conducted on geographies consisting of 193,185,882 people shows a mild positive correlation between the proportion of Albanians and percentage of population with a disability between the ages 34 and 64 in the United States with a correlation coefficient (R) of 0.323 and weighted average of 10.6%. Similarly, the statistical analysis conducted on geographies consisting of 296,962,722 people shows no correlation between the proportion of Argentineans and percentage of population with a disability between the ages 34 and 64 in the United States with a correlation coefficient (R) of -0.034 and weighted average of 9.4%, a difference of 13.4%.
Disability Age 35 to 64 Correlation Summary
| Measurement | Albanian | Argentinean |
| Minimum | 0.52% | 1.1% |
| Maximum | 27.1% | 20.2% |
| Range | 26.6% | 19.0% |
| Mean | 10.8% | 8.4% |
| Median | 10.3% | 8.2% |
| Interquartile 25% (IQ1) | 8.9% | 5.7% |
| Interquartile 75% (IQ3) | 11.8% | 10.3% |
| Interquartile Range (IQR) | 2.9% | 4.6% |
| Standard Deviation (Sample) | 4.6% | 3.9% |
| Standard Deviation (Population) | 4.5% | 3.9% |
Similar Demographics by Disability Age 35 to 64
Demographics Similar to Albanians by Disability Age 35 to 64
In terms of disability age 35 to 64, the demographic groups most similar to Albanians are Immigrants from Afghanistan (10.6%, a difference of 0.060%), Estonian (10.6%, a difference of 0.10%), Immigrants from Zimbabwe (10.6%, a difference of 0.10%), Maltese (10.6%, a difference of 0.22%), and Immigrants from Norway (10.6%, a difference of 0.31%).
| Demographics | Rating | Rank | Disability Age 35 to 64 |
| Immigrants | Moldova | 95.5 /100 | #118 | Exceptional 10.6% |
| Luxembourgers | 95.5 /100 | #119 | Exceptional 10.6% |
| Vietnamese | 95.4 /100 | #120 | Exceptional 10.6% |
| Romanians | 95.0 /100 | #121 | Exceptional 10.6% |
| Immigrants | Norway | 95.0 /100 | #122 | Exceptional 10.6% |
| Maltese | 94.8 /100 | #123 | Exceptional 10.6% |
| Estonians | 94.5 /100 | #124 | Exceptional 10.6% |
| Albanians | 94.2 /100 | #125 | Exceptional 10.6% |
| Immigrants | Afghanistan | 94.1 /100 | #126 | Exceptional 10.6% |
| Immigrants | Zimbabwe | 94.0 /100 | #127 | Exceptional 10.6% |
| South Africans | 93.3 /100 | #128 | Exceptional 10.7% |
| Ecuadorians | 93.1 /100 | #129 | Exceptional 10.7% |
| Immigrants | Syria | 93.0 /100 | #130 | Exceptional 10.7% |
| Immigrants | El Salvador | 92.8 /100 | #131 | Exceptional 10.7% |
| Immigrants | Albania | 92.5 /100 | #132 | Exceptional 10.7% |
Demographics Similar to Argentineans by Disability Age 35 to 64
In terms of disability age 35 to 64, the demographic groups most similar to Argentineans are Asian (9.4%, a difference of 0.010%), Cypriot (9.4%, a difference of 0.22%), Okinawan (9.4%, a difference of 0.25%), Venezuelan (9.4%, a difference of 0.31%), and Immigrants from Argentina (9.3%, a difference of 0.68%).
| Demographics | Rating | Rank | Disability Age 35 to 64 |
| Immigrants | Korea | 100.0 /100 | #16 | Exceptional 9.0% |
| Burmese | 100.0 /100 | #17 | Exceptional 9.2% |
| Soviet Union | 100.0 /100 | #18 | Exceptional 9.2% |
| Immigrants | Venezuela | 100.0 /100 | #19 | Exceptional 9.3% |
| Immigrants | Argentina | 100.0 /100 | #20 | Exceptional 9.3% |
| Okinawans | 100.0 /100 | #21 | Exceptional 9.4% |
| Cypriots | 100.0 /100 | #22 | Exceptional 9.4% |
| Argentineans | 100.0 /100 | #23 | Exceptional 9.4% |
| Asians | 100.0 /100 | #24 | Exceptional 9.4% |
| Venezuelans | 100.0 /100 | #25 | Exceptional 9.4% |
| Immigrants | Sri Lanka | 100.0 /100 | #26 | Exceptional 9.5% |
| Immigrants | Asia | 100.0 /100 | #27 | Exceptional 9.5% |
| Immigrants | Pakistan | 100.0 /100 | #28 | Exceptional 9.5% |
| Immigrants | Ireland | 100.0 /100 | #29 | Exceptional 9.5% |
| Immigrants | Japan | 100.0 /100 | #30 | Exceptional 9.5% |