Trinidadian and Tobagonian vs Immigrants from Ecuador Disability Age 35 to 64
COMPARE
Trinidadian and Tobagonian
Immigrants from Ecuador
Disability Age 35 to 64
Disability Age 35 to 64 Comparison
Trinidadians and Tobagonians
Immigrants from Ecuador
11.4%
DISABILITY AGE 35 TO 64
40.8/ 100
METRIC RATING
181st/ 347
METRIC RANK
10.7%
DISABILITY AGE 35 TO 64
92.5/ 100
METRIC RATING
134th/ 347
METRIC RANK
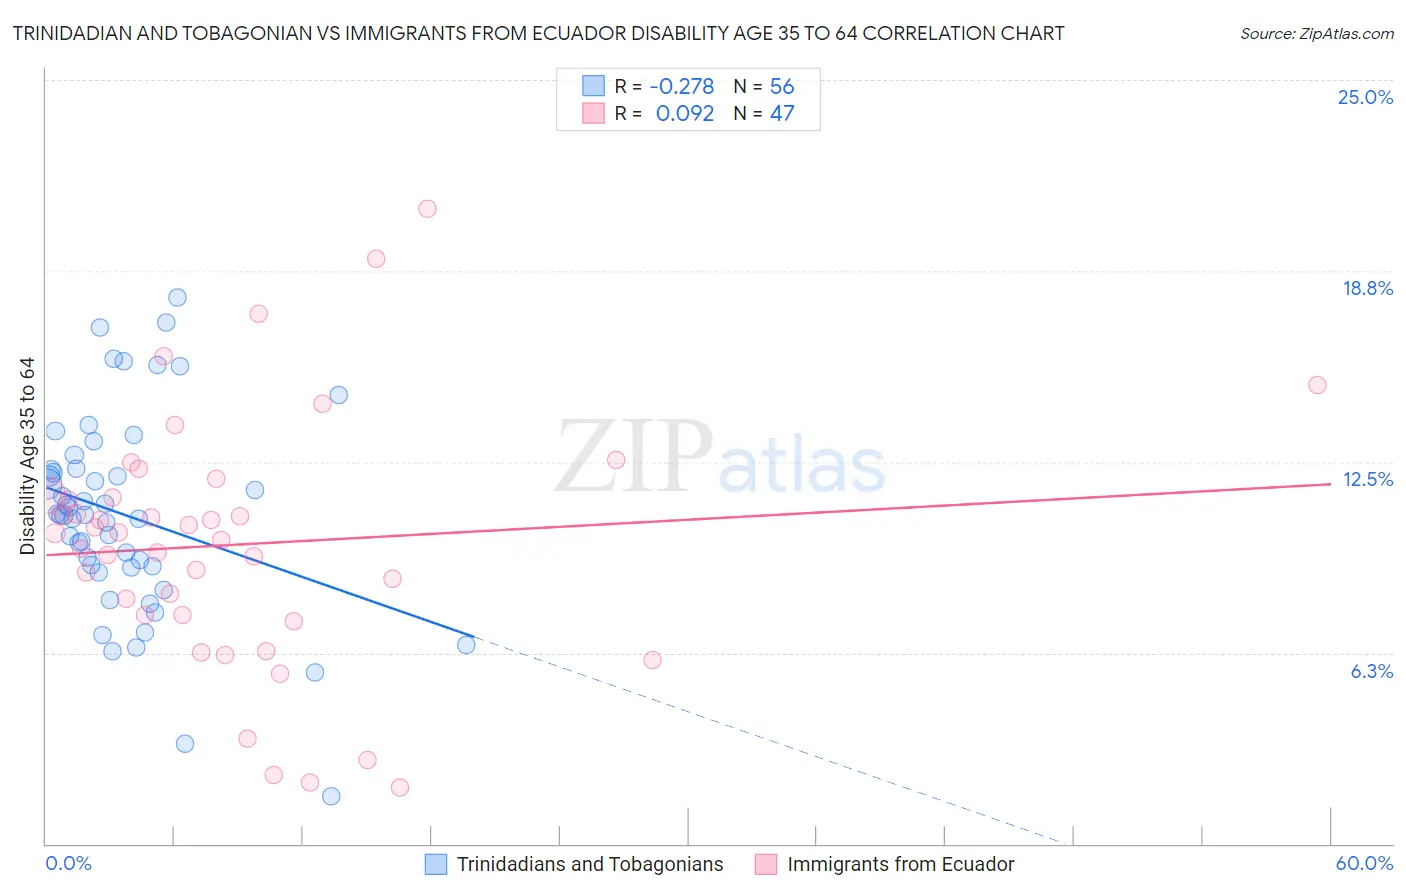
Trinidadian and Tobagonian vs Immigrants from Ecuador Disability Age 35 to 64 Correlation Chart
The statistical analysis conducted on geographies consisting of 219,688,298 people shows a weak negative correlation between the proportion of Trinidadians and Tobagonians and percentage of population with a disability between the ages 34 and 64 in the United States with a correlation coefficient (R) of -0.278 and weighted average of 11.4%. Similarly, the statistical analysis conducted on geographies consisting of 270,867,568 people shows a slight positive correlation between the proportion of Immigrants from Ecuador and percentage of population with a disability between the ages 34 and 64 in the United States with a correlation coefficient (R) of 0.092 and weighted average of 10.7%, a difference of 6.1%.
Disability Age 35 to 64 Correlation Summary
| Measurement | Trinidadian and Tobagonian | Immigrants from Ecuador |
| Minimum | 1.6% | 1.8% |
| Maximum | 17.9% | 20.8% |
| Range | 16.3% | 19.0% |
| Mean | 10.8% | 9.8% |
| Median | 10.8% | 10.2% |
| Interquartile 25% (IQ1) | 9.1% | 7.5% |
| Interquartile 75% (IQ3) | 12.3% | 11.4% |
| Interquartile Range (IQR) | 3.2% | 3.9% |
| Standard Deviation (Sample) | 3.3% | 4.1% |
| Standard Deviation (Population) | 3.3% | 4.1% |
Similar Demographics by Disability Age 35 to 64
Demographics Similar to Trinidadians and Tobagonians by Disability Age 35 to 64
In terms of disability age 35 to 64, the demographic groups most similar to Trinidadians and Tobagonians are Immigrants from Caribbean (11.3%, a difference of 0.060%), Immigrants from Barbados (11.3%, a difference of 0.070%), Icelander (11.4%, a difference of 0.090%), Polish (11.3%, a difference of 0.10%), and Immigrants from Oceania (11.4%, a difference of 0.10%).
| Demographics | Rating | Rank | Disability Age 35 to 64 |
| Immigrants | Fiji | 50.0 /100 | #174 | Average 11.3% |
| Czechs | 47.9 /100 | #175 | Average 11.3% |
| Ugandans | 43.7 /100 | #176 | Average 11.3% |
| Immigrants | Eastern Africa | 42.2 /100 | #177 | Average 11.3% |
| Poles | 42.0 /100 | #178 | Average 11.3% |
| Immigrants | Barbados | 41.6 /100 | #179 | Average 11.3% |
| Immigrants | Caribbean | 41.5 /100 | #180 | Average 11.3% |
| Trinidadians and Tobagonians | 40.8 /100 | #181 | Average 11.4% |
| Icelanders | 39.7 /100 | #182 | Fair 11.4% |
| Immigrants | Oceania | 39.5 /100 | #183 | Fair 11.4% |
| Kenyans | 39.2 /100 | #184 | Fair 11.4% |
| Danes | 36.8 /100 | #185 | Fair 11.4% |
| Slovenes | 36.6 /100 | #186 | Fair 11.4% |
| Immigrants | Bosnia and Herzegovina | 35.2 /100 | #187 | Fair 11.4% |
| Northern Europeans | 34.9 /100 | #188 | Fair 11.4% |
Demographics Similar to Immigrants from Ecuador by Disability Age 35 to 64
In terms of disability age 35 to 64, the demographic groups most similar to Immigrants from Ecuador are Immigrants (10.7%, a difference of 0.0%), Immigrants from Albania (10.7%, a difference of 0.010%), Greek (10.7%, a difference of 0.050%), Immigrants from El Salvador (10.7%, a difference of 0.11%), and Salvadoran (10.7%, a difference of 0.16%).
| Demographics | Rating | Rank | Disability Age 35 to 64 |
| Immigrants | Zimbabwe | 94.0 /100 | #127 | Exceptional 10.6% |
| South Africans | 93.3 /100 | #128 | Exceptional 10.7% |
| Ecuadorians | 93.1 /100 | #129 | Exceptional 10.7% |
| Immigrants | Syria | 93.0 /100 | #130 | Exceptional 10.7% |
| Immigrants | El Salvador | 92.8 /100 | #131 | Exceptional 10.7% |
| Immigrants | Albania | 92.5 /100 | #132 | Exceptional 10.7% |
| Immigrants | Immigrants | 92.5 /100 | #133 | Exceptional 10.7% |
| Immigrants | Ecuador | 92.5 /100 | #134 | Exceptional 10.7% |
| Greeks | 92.3 /100 | #135 | Exceptional 10.7% |
| Salvadorans | 91.9 /100 | #136 | Exceptional 10.7% |
| Immigrants | Costa Rica | 91.7 /100 | #137 | Exceptional 10.7% |
| Immigrants | Southern Europe | 91.5 /100 | #138 | Exceptional 10.7% |
| Costa Ricans | 91.4 /100 | #139 | Exceptional 10.7% |
| Immigrants | Scotland | 91.3 /100 | #140 | Exceptional 10.7% |
| Australians | 90.7 /100 | #141 | Exceptional 10.8% |