Tongan vs Immigrants from Nigeria Disability Age 65 to 74
COMPARE
Tongan
Immigrants from Nigeria
Disability Age 65 to 74
Disability Age 65 to 74 Comparison
Tongans
Immigrants from Nigeria
23.8%
DISABILITY AGE 65 TO 74
20.8/ 100
METRIC RATING
205th/ 347
METRIC RANK
24.0%
DISABILITY AGE 65 TO 74
11.7/ 100
METRIC RATING
218th/ 347
METRIC RANK
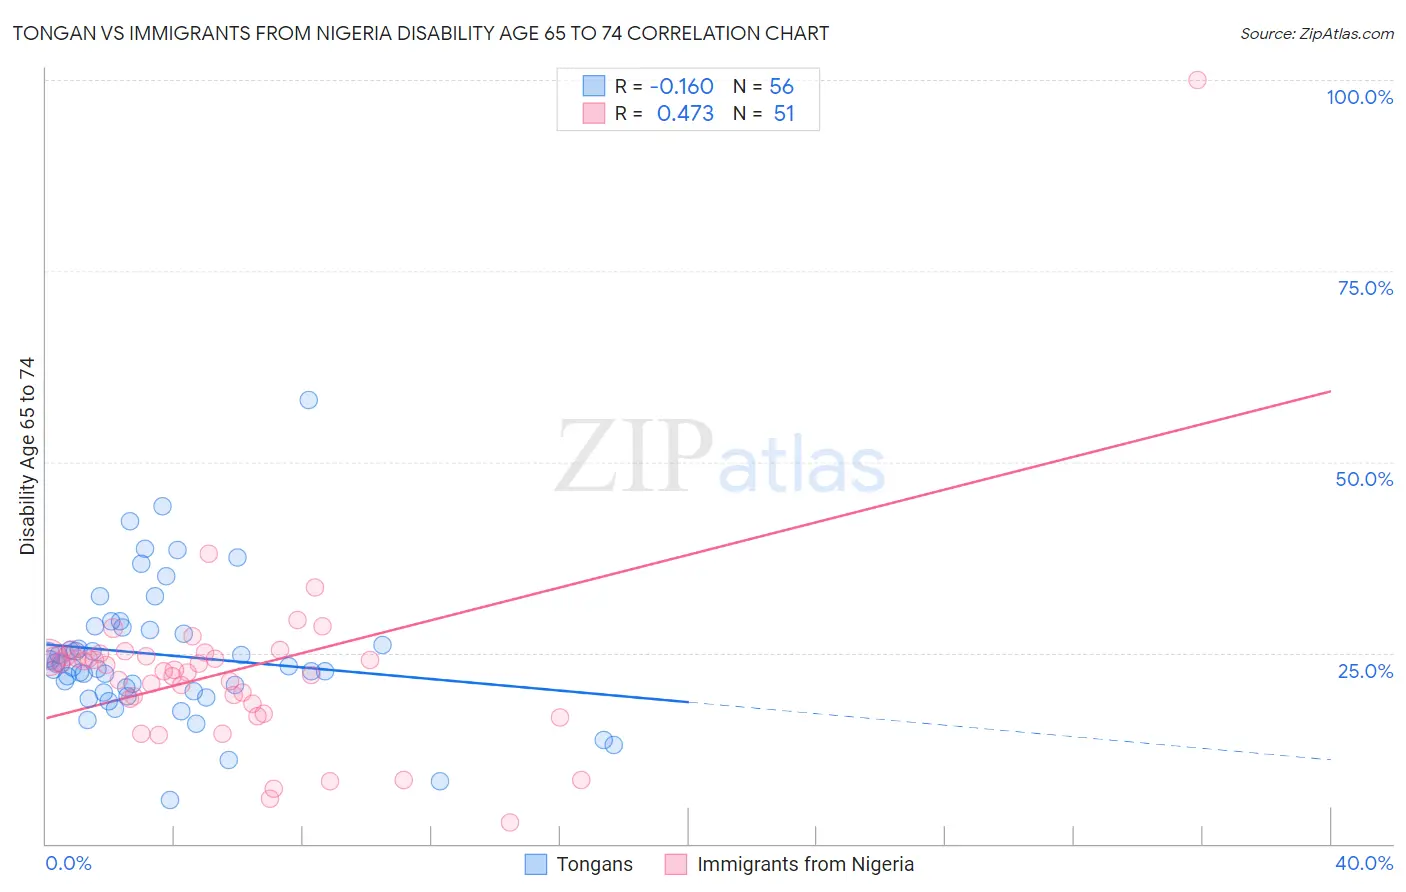
Tongan vs Immigrants from Nigeria Disability Age 65 to 74 Correlation Chart
The statistical analysis conducted on geographies consisting of 102,809,825 people shows a poor negative correlation between the proportion of Tongans and percentage of population with a disability between the ages 65 and 75 in the United States with a correlation coefficient (R) of -0.160 and weighted average of 23.8%. Similarly, the statistical analysis conducted on geographies consisting of 283,043,731 people shows a moderate positive correlation between the proportion of Immigrants from Nigeria and percentage of population with a disability between the ages 65 and 75 in the United States with a correlation coefficient (R) of 0.473 and weighted average of 24.0%, a difference of 0.97%.
Disability Age 65 to 74 Correlation Summary
| Measurement | Tongan | Immigrants from Nigeria |
| Minimum | 5.7% | 2.8% |
| Maximum | 58.2% | 100.0% |
| Range | 52.5% | 97.2% |
| Mean | 24.7% | 22.5% |
| Median | 23.2% | 22.7% |
| Interquartile 25% (IQ1) | 20.0% | 18.3% |
| Interquartile 75% (IQ3) | 28.1% | 24.5% |
| Interquartile Range (IQR) | 8.2% | 6.2% |
| Standard Deviation (Sample) | 9.0% | 13.0% |
| Standard Deviation (Population) | 8.9% | 12.9% |
Demographics Similar to Tongans and Immigrants from Nigeria by Disability Age 65 to 74
In terms of disability age 65 to 74, the demographic groups most similar to Tongans are Immigrants from Jamaica (23.8%, a difference of 0.0%), Immigrants from Sudan (23.8%, a difference of 0.060%), Immigrants from Barbados (23.8%, a difference of 0.10%), Immigrants from Grenada (23.8%, a difference of 0.11%), and Immigrants from Kenya (23.8%, a difference of 0.11%). Similarly, the demographic groups most similar to Immigrants from Nigeria are Immigrants from Portugal (24.0%, a difference of 0.0%), Immigrants from Burma/Myanmar (24.0%, a difference of 0.020%), Jamaican (24.0%, a difference of 0.070%), Ghanaian (24.1%, a difference of 0.19%), and Pennsylvania German (24.0%, a difference of 0.20%).
| Demographics | Rating | Rank | Disability Age 65 to 74 |
| Immigrants | Ecuador | 23.9 /100 | #201 | Fair 23.7% |
| Immigrants | Bahamas | 23.3 /100 | #202 | Fair 23.7% |
| Kenyans | 23.2 /100 | #203 | Fair 23.7% |
| Immigrants | Grenada | 22.1 /100 | #204 | Fair 23.8% |
| Tongans | 20.8 /100 | #205 | Fair 23.8% |
| Immigrants | Jamaica | 20.7 /100 | #206 | Fair 23.8% |
| Immigrants | Sudan | 20.1 /100 | #207 | Fair 23.8% |
| Immigrants | Barbados | 19.6 /100 | #208 | Poor 23.8% |
| Immigrants | Kenya | 19.6 /100 | #209 | Poor 23.8% |
| Trinidadians and Tobagonians | 16.4 /100 | #210 | Poor 23.9% |
| Immigrants | West Indies | 15.9 /100 | #211 | Poor 23.9% |
| French | 15.7 /100 | #212 | Poor 23.9% |
| Nicaraguans | 14.3 /100 | #213 | Poor 23.9% |
| Immigrants | Oceania | 13.6 /100 | #214 | Poor 24.0% |
| Pennsylvania Germans | 13.3 /100 | #215 | Poor 24.0% |
| Jamaicans | 12.2 /100 | #216 | Poor 24.0% |
| Immigrants | Portugal | 11.7 /100 | #217 | Poor 24.0% |
| Immigrants | Nigeria | 11.7 /100 | #218 | Poor 24.0% |
| Immigrants | Burma/Myanmar | 11.6 /100 | #219 | Poor 24.0% |
| Ghanaians | 10.4 /100 | #220 | Poor 24.1% |
| Immigrants | Nicaragua | 9.8 /100 | #221 | Tragic 24.1% |