Tohono O'odham vs Taiwanese Median Family Income
COMPARE
Tohono O'odham
Taiwanese
Median Family Income
Median Family Income Comparison
Tohono O'odham
Taiwanese
$72,193
MEDIAN FAMILY INCOME
0.0/ 100
METRIC RATING
344th/ 347
METRIC RANK
$107,295
MEDIAN FAMILY INCOME
91.4/ 100
METRIC RATING
125th/ 347
METRIC RANK
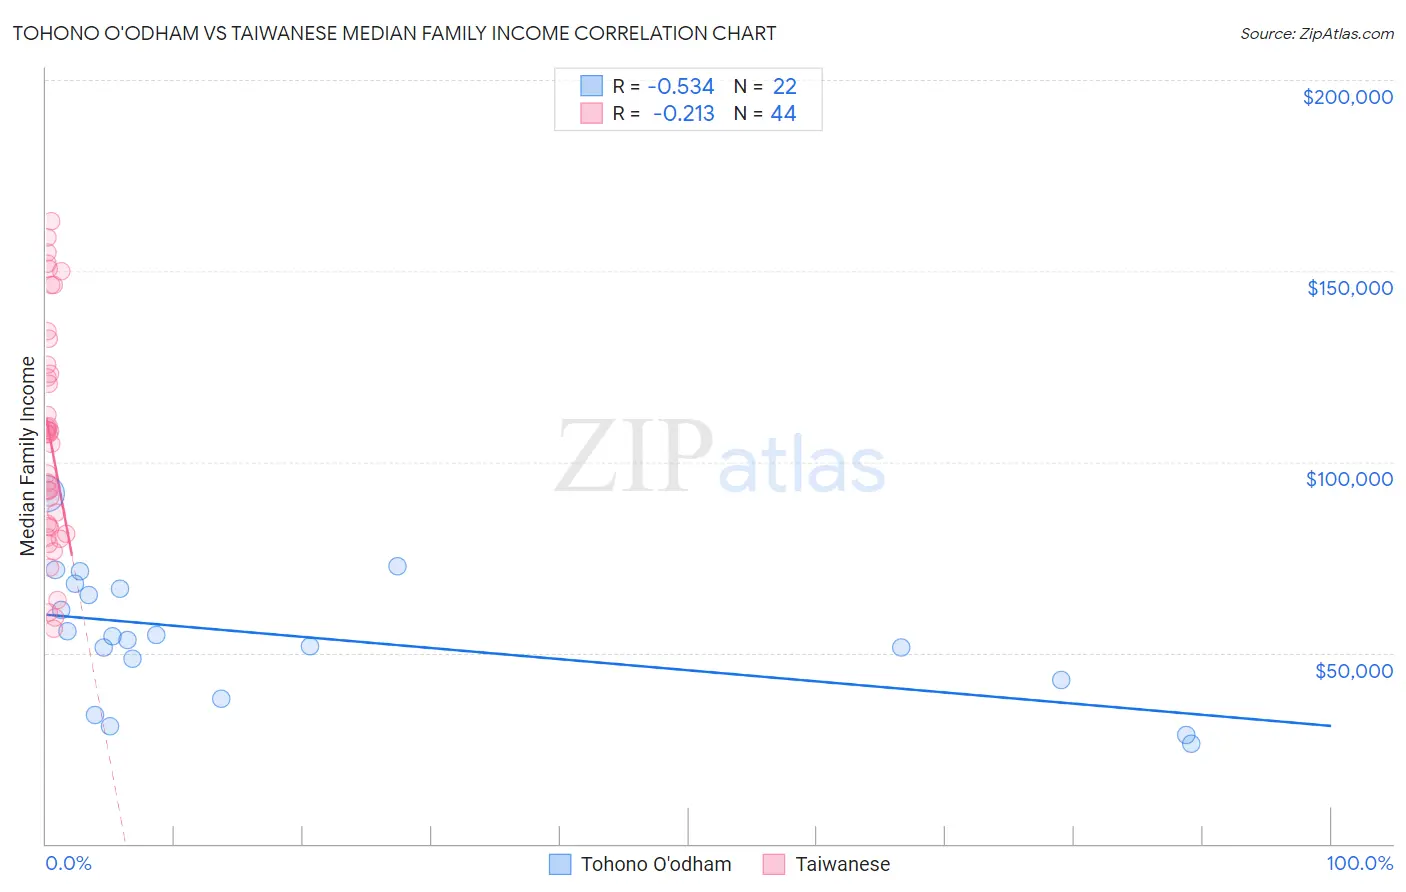
Tohono O'odham vs Taiwanese Median Family Income Correlation Chart
The statistical analysis conducted on geographies consisting of 58,714,192 people shows a substantial negative correlation between the proportion of Tohono O'odham and median family income in the United States with a correlation coefficient (R) of -0.534 and weighted average of $72,193. Similarly, the statistical analysis conducted on geographies consisting of 31,709,765 people shows a weak negative correlation between the proportion of Taiwanese and median family income in the United States with a correlation coefficient (R) of -0.213 and weighted average of $107,295, a difference of 48.6%.
Median Family Income Correlation Summary
| Measurement | Tohono O'odham | Taiwanese |
| Minimum | $26,100 | $56,146 |
| Maximum | $91,728 | $162,974 |
| Range | $65,628 | $106,828 |
| Mean | $54,111 | $106,094 |
| Median | $53,986 | $107,372 |
| Interquartile 25% (IQ1) | $43,011 | $83,038 |
| Interquartile 75% (IQ3) | $66,792 | $124,300 |
| Interquartile Range (IQR) | $23,781 | $41,262 |
| Standard Deviation (Sample) | $16,520 | $29,129 |
| Standard Deviation (Population) | $16,140 | $28,796 |
Similar Demographics by Median Family Income
Demographics Similar to Tohono O'odham by Median Family Income
In terms of median family income, the demographic groups most similar to Tohono O'odham are Navajo ($70,989, a difference of 1.7%), Puerto Rican ($70,423, a difference of 2.5%), Lumbee ($68,679, a difference of 5.1%), Houma ($76,188, a difference of 5.5%), and Crow ($76,605, a difference of 6.1%).
| Demographics | Rating | Rank | Median Family Income |
| Kiowa | 0.0 /100 | #333 | Tragic $80,885 |
| Menominee | 0.0 /100 | #334 | Tragic $79,563 |
| Yup'ik | 0.0 /100 | #335 | Tragic $79,290 |
| Immigrants | Cuba | 0.0 /100 | #336 | Tragic $78,249 |
| Yuman | 0.0 /100 | #337 | Tragic $78,055 |
| Immigrants | Yemen | 0.0 /100 | #338 | Tragic $77,457 |
| Pima | 0.0 /100 | #339 | Tragic $77,431 |
| Hopi | 0.0 /100 | #340 | Tragic $77,188 |
| Pueblo | 0.0 /100 | #341 | Tragic $76,880 |
| Crow | 0.0 /100 | #342 | Tragic $76,605 |
| Houma | 0.0 /100 | #343 | Tragic $76,188 |
| Tohono O'odham | 0.0 /100 | #344 | Tragic $72,193 |
| Navajo | 0.0 /100 | #345 | Tragic $70,989 |
| Puerto Ricans | 0.0 /100 | #346 | Tragic $70,423 |
| Lumbee | 0.0 /100 | #347 | Tragic $68,679 |
Demographics Similar to Taiwanese by Median Family Income
In terms of median family income, the demographic groups most similar to Taiwanese are Pakistani ($107,390, a difference of 0.090%), Serbian ($107,157, a difference of 0.13%), Carpatho Rusyn ($107,502, a difference of 0.19%), Lebanese ($107,086, a difference of 0.19%), and Immigrants from Ethiopia ($106,969, a difference of 0.30%).
| Demographics | Rating | Rank | Median Family Income |
| Ethiopians | 94.5 /100 | #118 | Exceptional $108,251 |
| Sri Lankans | 94.5 /100 | #119 | Exceptional $108,234 |
| Immigrants | Northern Africa | 94.3 /100 | #120 | Exceptional $108,161 |
| Europeans | 94.1 /100 | #121 | Exceptional $108,099 |
| Immigrants | Jordan | 92.9 /100 | #122 | Exceptional $107,715 |
| Carpatho Rusyns | 92.2 /100 | #123 | Exceptional $107,502 |
| Pakistanis | 91.7 /100 | #124 | Exceptional $107,390 |
| Taiwanese | 91.4 /100 | #125 | Exceptional $107,295 |
| Serbians | 90.8 /100 | #126 | Exceptional $107,157 |
| Lebanese | 90.5 /100 | #127 | Exceptional $107,086 |
| Immigrants | Ethiopia | 90.0 /100 | #128 | Excellent $106,969 |
| Arabs | 89.9 /100 | #129 | Excellent $106,952 |
| Brazilians | 89.8 /100 | #130 | Excellent $106,942 |
| Canadians | 88.1 /100 | #131 | Excellent $106,597 |
| Immigrants | Fiji | 87.8 /100 | #132 | Excellent $106,544 |