Immigrants from France vs Venezuelan Hearing Disability
COMPARE
Immigrants from France
Venezuelan
Hearing Disability
Hearing Disability Comparison
Immigrants from France
Venezuelans
2.9%
HEARING DISABILITY
73.1/ 100
METRIC RATING
151st/ 347
METRIC RANK
2.6%
HEARING DISABILITY
99.4/ 100
METRIC RATING
45th/ 347
METRIC RANK
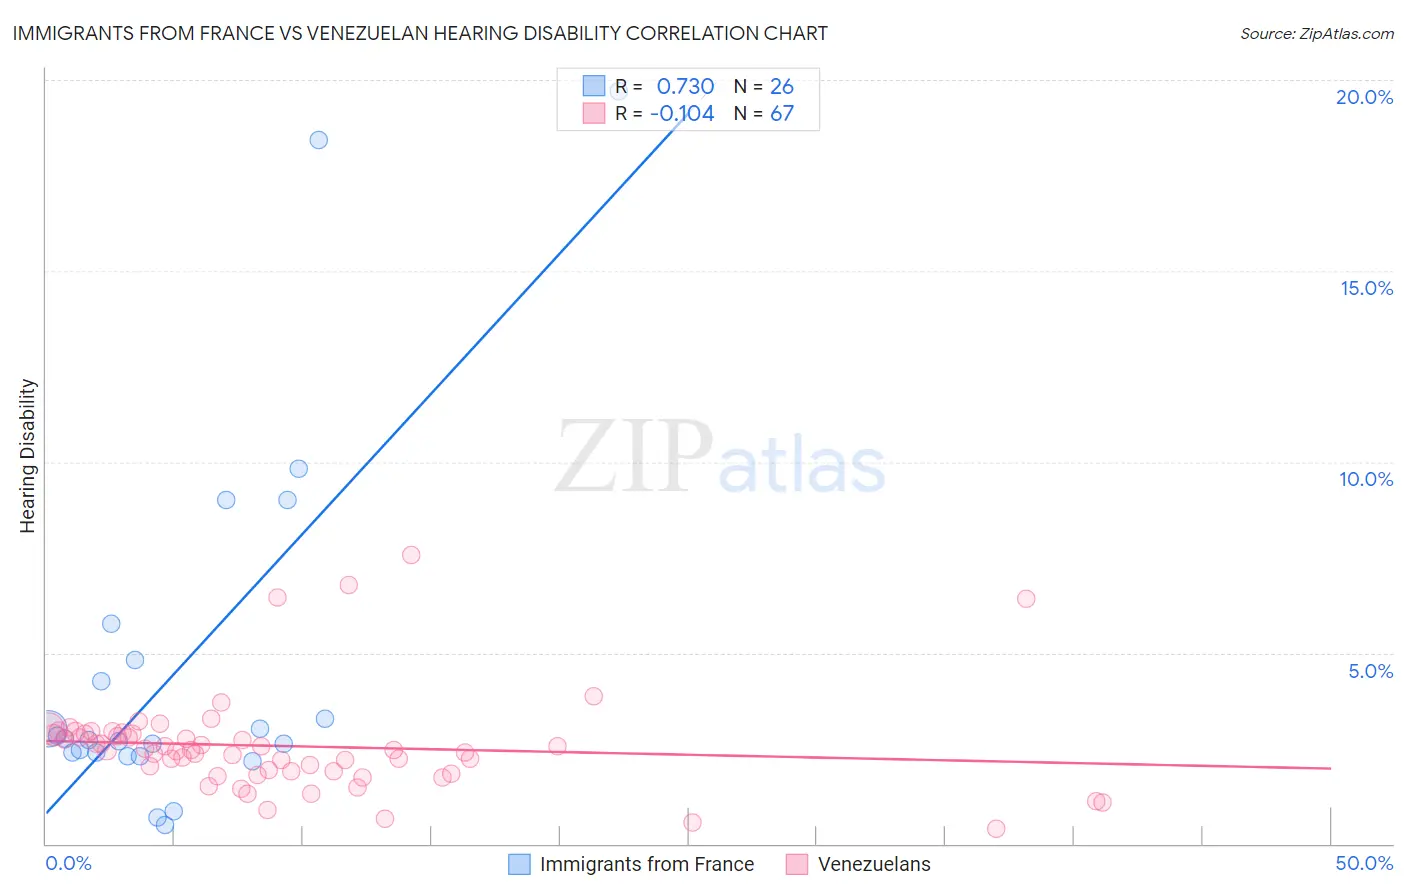
Immigrants from France vs Venezuelan Hearing Disability Correlation Chart
The statistical analysis conducted on geographies consisting of 287,858,802 people shows a strong positive correlation between the proportion of Immigrants from France and percentage of population with hearing disability in the United States with a correlation coefficient (R) of 0.730 and weighted average of 2.9%. Similarly, the statistical analysis conducted on geographies consisting of 306,240,501 people shows a poor negative correlation between the proportion of Venezuelans and percentage of population with hearing disability in the United States with a correlation coefficient (R) of -0.104 and weighted average of 2.6%, a difference of 10.7%.
Hearing Disability Correlation Summary
| Measurement | Immigrants from France | Venezuelan |
| Minimum | 0.48% | 0.40% |
| Maximum | 19.7% | 7.6% |
| Range | 19.2% | 7.2% |
| Mean | 4.7% | 2.6% |
| Median | 2.7% | 2.4% |
| Interquartile 25% (IQ1) | 2.4% | 1.9% |
| Interquartile 75% (IQ3) | 4.8% | 2.9% |
| Interquartile Range (IQR) | 2.4% | 0.97% |
| Standard Deviation (Sample) | 4.9% | 1.3% |
| Standard Deviation (Population) | 4.8% | 1.3% |
Similar Demographics by Hearing Disability
Demographics Similar to Immigrants from France by Hearing Disability
In terms of hearing disability, the demographic groups most similar to Immigrants from France are Immigrants from Lithuania (2.9%, a difference of 0.010%), Palestinian (2.9%, a difference of 0.060%), Sudanese (2.9%, a difference of 0.12%), Immigrants from Lebanon (2.9%, a difference of 0.19%), and Costa Rican (2.9%, a difference of 0.21%).
| Demographics | Rating | Rank | Hearing Disability |
| Immigrants | Bulgaria | 79.2 /100 | #144 | Good 2.9% |
| Immigrants | Congo | 78.9 /100 | #145 | Good 2.9% |
| Brazilians | 78.7 /100 | #146 | Good 2.9% |
| Tongans | 78.6 /100 | #147 | Good 2.9% |
| Immigrants | Russia | 77.7 /100 | #148 | Good 2.9% |
| Immigrants | Panama | 76.9 /100 | #149 | Good 2.9% |
| Palestinians | 73.6 /100 | #150 | Good 2.9% |
| Immigrants | France | 73.1 /100 | #151 | Good 2.9% |
| Immigrants | Lithuania | 73.0 /100 | #152 | Good 2.9% |
| Sudanese | 72.1 /100 | #153 | Good 2.9% |
| Immigrants | Lebanon | 71.5 /100 | #154 | Good 2.9% |
| Costa Ricans | 71.4 /100 | #155 | Good 2.9% |
| Immigrants | Poland | 70.2 /100 | #156 | Good 2.9% |
| Immigrants | Kazakhstan | 69.6 /100 | #157 | Good 2.9% |
| Immigrants | Burma/Myanmar | 69.5 /100 | #158 | Good 2.9% |
Demographics Similar to Venezuelans by Hearing Disability
In terms of hearing disability, the demographic groups most similar to Venezuelans are Nigerian (2.6%, a difference of 0.020%), Immigrants from Dominica (2.6%, a difference of 0.10%), West Indian (2.6%, a difference of 0.25%), Senegalese (2.6%, a difference of 0.25%), and Immigrants from Israel (2.6%, a difference of 0.25%).
| Demographics | Rating | Rank | Hearing Disability |
| Immigrants | Jamaica | 99.5 /100 | #38 | Exceptional 2.6% |
| Immigrants | China | 99.5 /100 | #39 | Exceptional 2.6% |
| Haitians | 99.5 /100 | #40 | Exceptional 2.6% |
| Immigrants | Taiwan | 99.4 /100 | #41 | Exceptional 2.6% |
| West Indians | 99.4 /100 | #42 | Exceptional 2.6% |
| Senegalese | 99.4 /100 | #43 | Exceptional 2.6% |
| Nigerians | 99.4 /100 | #44 | Exceptional 2.6% |
| Venezuelans | 99.4 /100 | #45 | Exceptional 2.6% |
| Immigrants | Dominica | 99.3 /100 | #46 | Exceptional 2.6% |
| Immigrants | Israel | 99.3 /100 | #47 | Exceptional 2.6% |
| Immigrants | Singapore | 99.3 /100 | #48 | Exceptional 2.6% |
| Immigrants | South America | 99.2 /100 | #49 | Exceptional 2.7% |
| Paraguayans | 99.2 /100 | #50 | Exceptional 2.7% |
| Immigrants | Hong Kong | 99.2 /100 | #51 | Exceptional 2.7% |
| Jamaicans | 99.0 /100 | #52 | Exceptional 2.7% |