Taiwanese vs New Zealander Cognitive Disability
COMPARE
Taiwanese
New Zealander
Cognitive Disability
Cognitive Disability Comparison
Taiwanese
New Zealanders
17.6%
COGNITIVE DISABILITY
7.7/ 100
METRIC RATING
211th/ 347
METRIC RANK
17.4%
COGNITIVE DISABILITY
21.1/ 100
METRIC RATING
195th/ 347
METRIC RANK
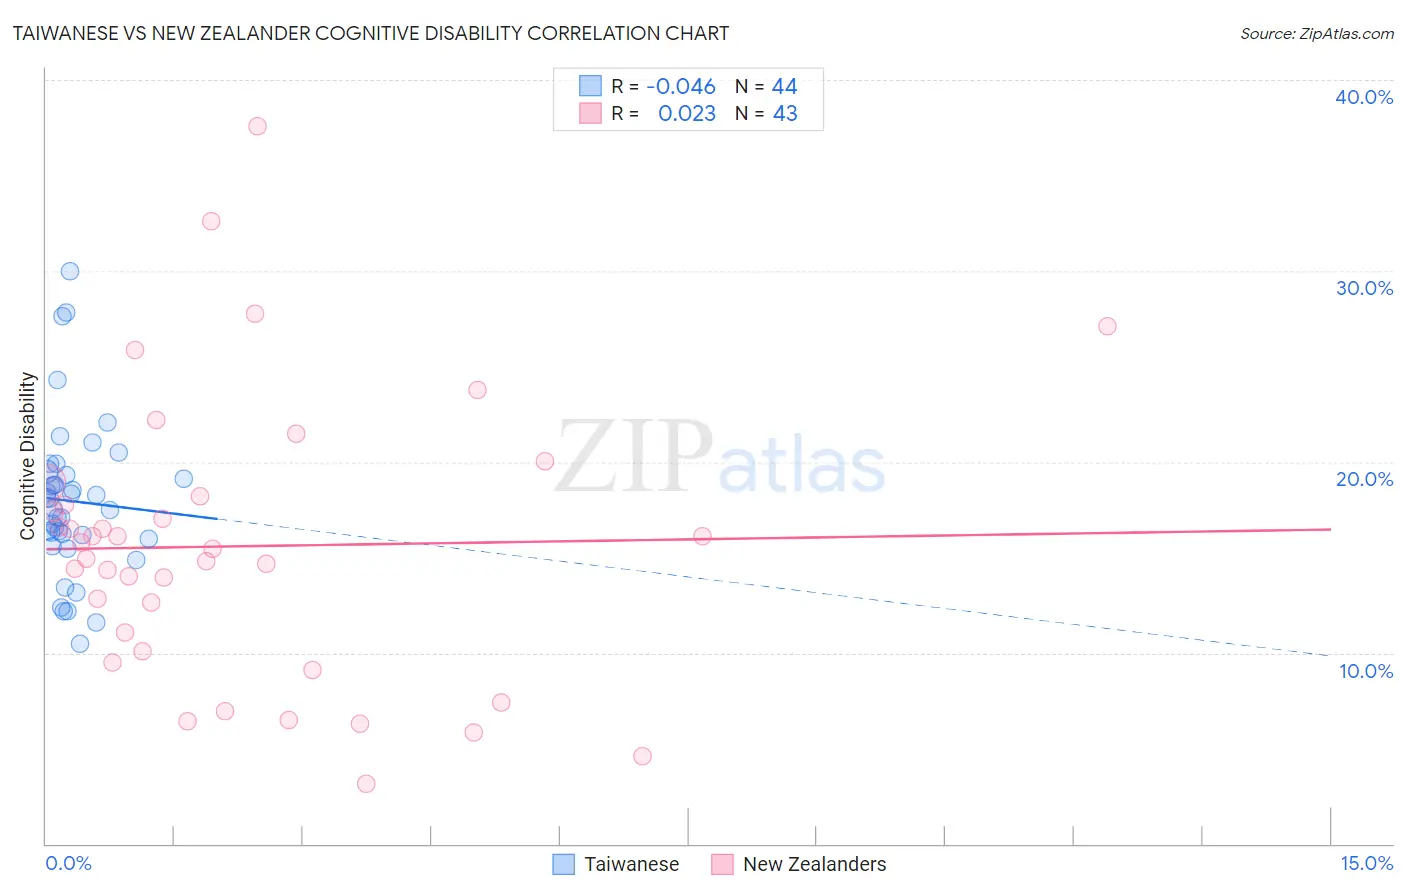
Taiwanese vs New Zealander Cognitive Disability Correlation Chart
The statistical analysis conducted on geographies consisting of 31,724,936 people shows no correlation between the proportion of Taiwanese and percentage of population with cognitive disability in the United States with a correlation coefficient (R) of -0.046 and weighted average of 17.6%. Similarly, the statistical analysis conducted on geographies consisting of 106,922,503 people shows no correlation between the proportion of New Zealanders and percentage of population with cognitive disability in the United States with a correlation coefficient (R) of 0.023 and weighted average of 17.4%, a difference of 0.82%.
Cognitive Disability Correlation Summary
| Measurement | Taiwanese | New Zealander |
| Minimum | 10.5% | 3.1% |
| Maximum | 30.0% | 37.6% |
| Range | 19.5% | 34.5% |
| Mean | 17.9% | 15.6% |
| Median | 17.8% | 15.4% |
| Interquartile 25% (IQ1) | 16.1% | 10.1% |
| Interquartile 75% (IQ3) | 19.4% | 18.2% |
| Interquartile Range (IQR) | 3.3% | 8.2% |
| Standard Deviation (Sample) | 4.1% | 7.4% |
| Standard Deviation (Population) | 4.0% | 7.3% |
Demographics Similar to Taiwanese and New Zealanders by Cognitive Disability
In terms of cognitive disability, the demographic groups most similar to Taiwanese are Immigrants from Oceania (17.6%, a difference of 0.040%), Hawaiian (17.6%, a difference of 0.050%), Immigrants from Jamaica (17.6%, a difference of 0.070%), Immigrants from Trinidad and Tobago (17.6%, a difference of 0.090%), and Immigrants from Cameroon (17.6%, a difference of 0.14%). Similarly, the demographic groups most similar to New Zealanders are Immigrants from Bosnia and Herzegovina (17.4%, a difference of 0.040%), Guyanese (17.5%, a difference of 0.16%), Delaware (17.4%, a difference of 0.18%), Immigrants from Afghanistan (17.5%, a difference of 0.20%), and Immigrants from Panama (17.5%, a difference of 0.30%).
| Demographics | Rating | Rank | Cognitive Disability |
| Delaware | 25.6 /100 | #193 | Fair 17.4% |
| Immigrants | Bosnia and Herzegovina | 22.0 /100 | #194 | Fair 17.4% |
| New Zealanders | 21.1 /100 | #195 | Fair 17.4% |
| Guyanese | 17.5 /100 | #196 | Poor 17.5% |
| Immigrants | Afghanistan | 16.7 /100 | #197 | Poor 17.5% |
| Immigrants | Panama | 14.8 /100 | #198 | Poor 17.5% |
| Immigrants | Singapore | 14.3 /100 | #199 | Poor 17.5% |
| Haitians | 14.1 /100 | #200 | Poor 17.5% |
| South American Indians | 13.0 /100 | #201 | Poor 17.5% |
| Immigrants | Morocco | 12.0 /100 | #202 | Poor 17.5% |
| Immigrants | Caribbean | 11.0 /100 | #203 | Poor 17.5% |
| Immigrants | Zimbabwe | 11.0 /100 | #204 | Poor 17.5% |
| Puget Sound Salish | 10.9 /100 | #205 | Poor 17.5% |
| Alaska Natives | 10.4 /100 | #206 | Poor 17.5% |
| Immigrants | Latin America | 9.7 /100 | #207 | Tragic 17.6% |
| Immigrants | Cameroon | 9.3 /100 | #208 | Tragic 17.6% |
| Immigrants | Trinidad and Tobago | 8.7 /100 | #209 | Tragic 17.6% |
| Immigrants | Jamaica | 8.5 /100 | #210 | Tragic 17.6% |
| Taiwanese | 7.7 /100 | #211 | Tragic 17.6% |
| Immigrants | Oceania | 7.3 /100 | #212 | Tragic 17.6% |
| Hawaiians | 7.2 /100 | #213 | Tragic 17.6% |